What is a Stock Split?

A stock split is a corporate action in which a company splits its outstanding shares into a larger number of shares at a lower price per share, without changing the value of the company or the value of investors’ investments. This article thoroughly discusses the types of stock splits, a list of stocks that have done so, calculation examples, and the benefits and risks of stock splits for issuers and investors.
Article Summary
- 📌 Stock splits increase the number of shares and decrease the price per share without changing the value of the investment.
- 📊 There are various stock split ratios, such as 2:1, 3:1, up to 10:1.
- 👩🏻💻 Many well-known Indonesian and global stocks have conducted stock splits in the past decade.
- ⚖️ A stock split is different from a reverse stock split which reduces the number of outstanding shares.
- 📈 The impact of a stock split can be positive in the short term, but it still depends on the fundamentals of the company.
What is a Stock Split?
Source: Vision Retirement
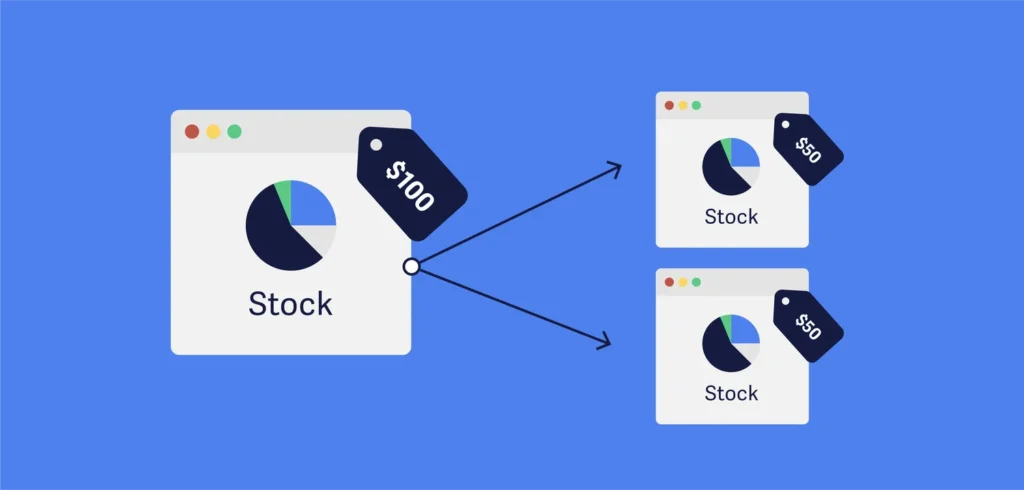
A stock split is a corporate action in which a company divides its outstanding shares into a larger number at a lower price per share. This step aims to increase liquidity and facilitate stock transactions in the market, without changing the total value of the company or the value of the investment held by investors.
In practice, the number of investor shares will increase, but the total value remains the same. For example, in a 2:1 stock split, one share worth Rp1,000 turns into two shares of Rp500 each. This condition reflects the meaning of stock splits in stocks as a strategy to make shares more affordable for retail investors, as well as often perceived as a signal of management optimism about the company’s future performance.
Types of Stock Splits
Stock splits can be done with various ratios, which show how the number of shares and the price per share will change. If the first number in the ratio is larger, such as 2:1, then the number of shares outstanding will increase. This ratio reflects how many new shares investors receive after a stock split.
Here are some commonly used types of stock splits:
- 5:1 In a 5 for 1 stock split, every one old share will turn into five shares. This means that the company adds four new shares for each outstanding share, while the price per share drops proportionally and the value of the company remains the same.
- 2:1 Stock split 2 to 1 means that every one old share becomes two shares. This ratio is one of the most commonly used as it effectively lowers the share price without changing the value of the investor’s investment.
- 3:1 In a 3-to-1 ratio, every one old share is split into three new shares. The investor acquires two additional shares, with an equal price per share adjustment.
- 3:2 In a 3 for 2 stock split, two old shares will become three new shares. This type is also quite common and results in an increase in the number of shares with a more moderate decrease in the price per share.
3 Global Stocks that Have Performed Stock Splits
Among the various global stocks listed in the market, several well-known companies have conducted stock splits as part of their corporate strategy to improve liquidity and affordability. Below are examples of international stocks that have conducted stock splits:
1. Apple (AAPL)
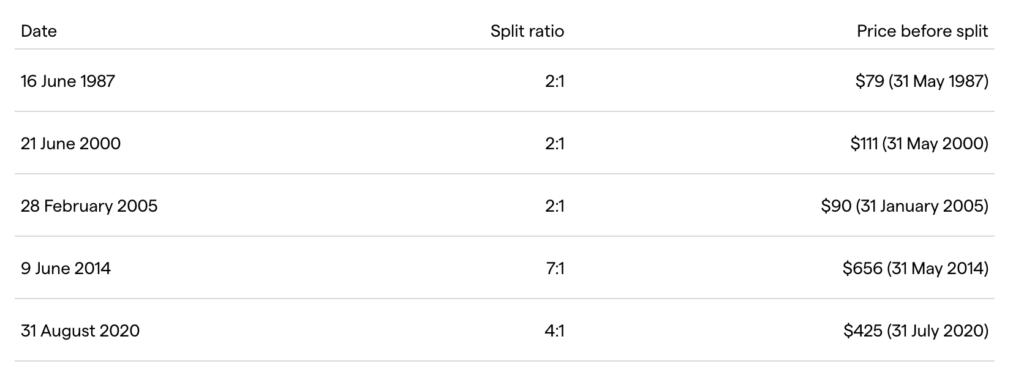
Apple has conducted a total of five stock splits throughout its history. The most recent split occurred on August 31, 2020 with a ratio of 4:1. Previously, Apple conducted stock splits with a ratio of 2:1 in 1987, 2000, and 2005, and a 7:1 split in 2014.
For example, if an investor bought one share of AAPL before the first stock split on June 16, 1987, that share would now be equivalent to 224 shares of AAPL after five stock splits. This shows that although the number of shares increased, the total value of the investment remained the same, while the price per share decreased according to the split ratio applied.
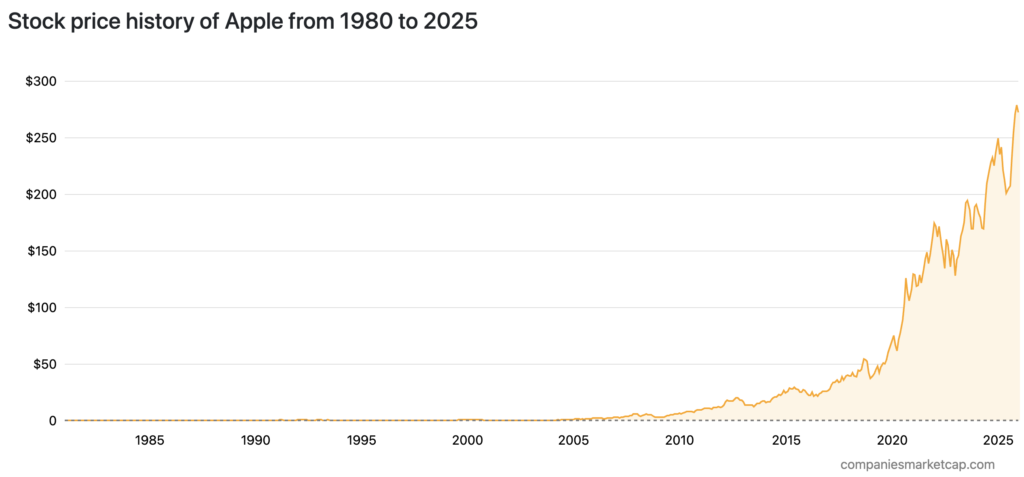
The share price movement of Apple (AAPL) from 1980 to 2025 shows very significant spikes, especially after 2010. At first, AAPL’s share price was relatively stagnant until around 2000, with a more pronounced increase after the launch of iconic products. After 2010, the share price continued to increase rapidly, reaching a level of over $250 by 2025.
2. Amazon (AMZN)
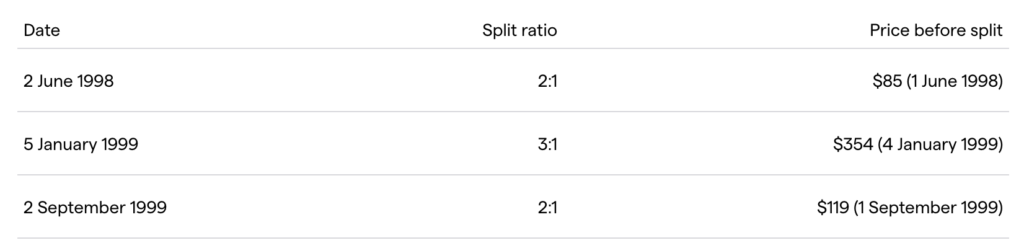
Amazon has conducted a total of four stock splits in its history, with the most recent on June 6, 2022. The table above shows some of the stock splits Amazon has done, starting on June 2, 1998 with a ratio of 2:1, where the stock price before the split was $85. The next stock split occurred on January 5, 1999 with a ratio of 3:1, when the stock price was $354. On September 2, 1999, Amazon did another stock split with a ratio of 2:1, the stock price before the split was $119.
If an investor bought one Amazon share before the first stock split on June 2, 1998, that share is now equivalent to 240 AMZN shares after four stock splits. This shows how Amazon stock has evolved over time, and even though the number of shares has increased, the total value of the investment has been maintained thanks to the share price adjustments made with each stock split.
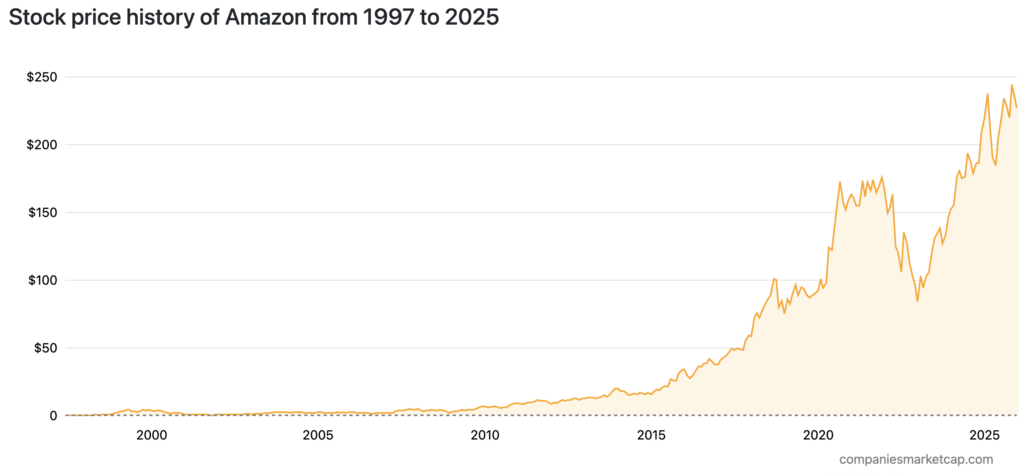
Amazon’s (AMZN) share price movement from 1997 to 2025 shows significant spikes, especially after 2015. At first, Amazon’s share price was relatively low, even close to zero in the early 2000s, before it started to rise steadily. After 2015, Amazon’s share price surged sharply, fueled by the company’s expansion and dominance of the global e-commerce market. Until 2025, AMZN’s share price continues to show a very rapid growth trend.
3. NVIDIA (NVDA)
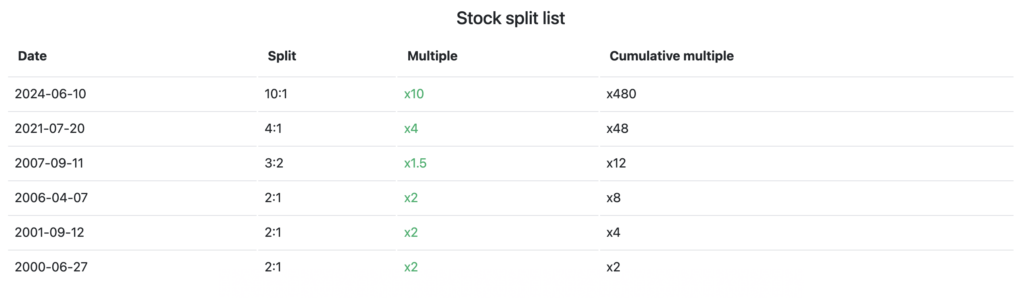
NVIDIA has conducted a total of 6 stock splits throughout its history, with the most recent on June 10, 2024, at a ratio of 10:1. The table above shows some of the dates and stock split ratios conducted by NVIDIA, starting on June 27, 2000 with a ratio of 2:1, and continuing with larger ratios, such as 3:2 on September 11, 2007 and 4:1 on July 20, 2021.
If an investor bought one NVIDIA share before the first stock split on June 27, 2000, that share is now equivalent to 480 NVDA shares after six stock splits. This shows how the number of shares increases over time, while the price per share is adjusted according to the split ratio applied, but the total value of the investment is maintained.
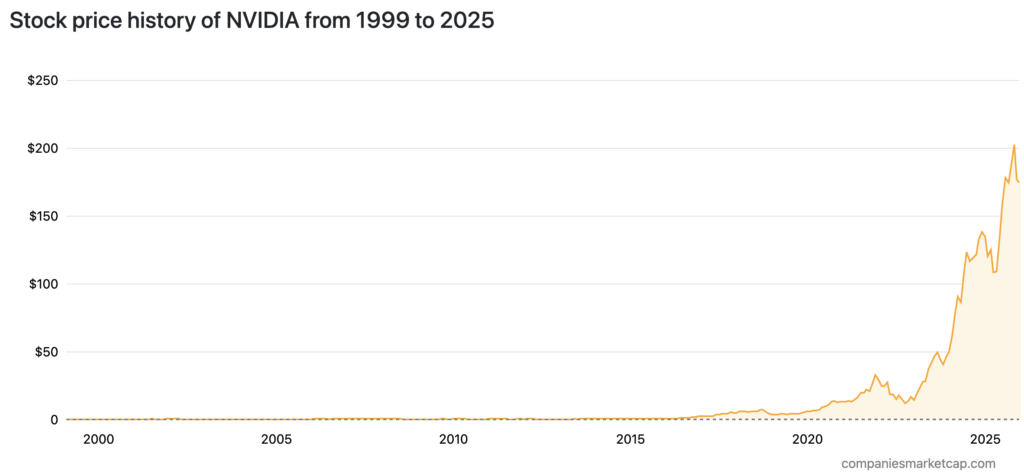
NVIDIA (NVDA)’s stock price movement from 1999 to 2025 shows a significant increase, especially after 2015. In 1999, its share price was under $1, and by 2015, it was around $20. Since 2020, the stock price has risen sharply, reaching more than $200 in 2025. This surge reflects NVIDIA’s success in leading the semiconductor market and GPU technology.
3 Reasons Issuers Do Stock Split
Here are three main reasons why issuers choose to do a stock split:
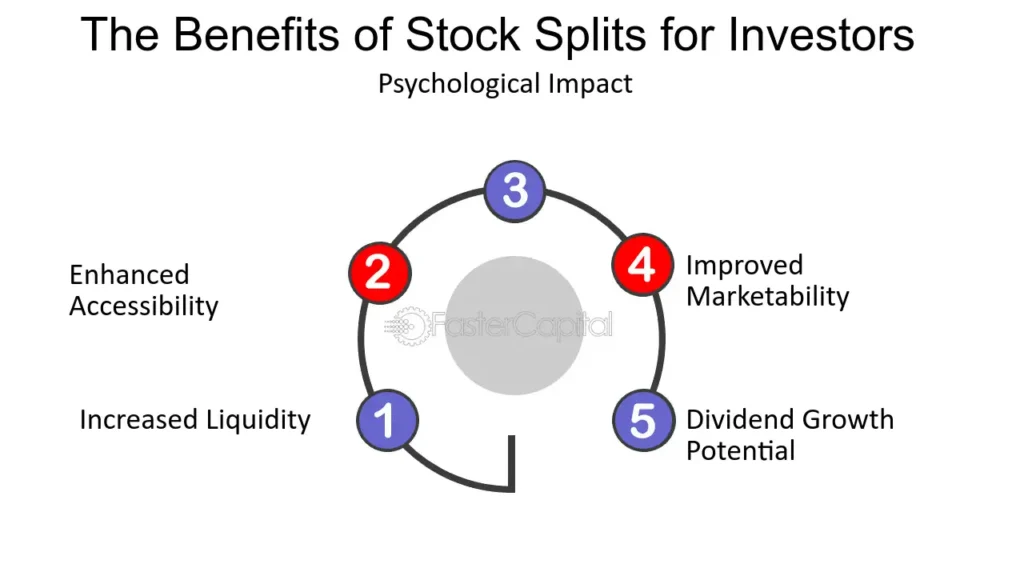
- Attracting Retail Investors One of the main reasons issuers conduct stock splits is to lower the share price to make it more affordable for retail investors. A lower share price reduces entry barriers for small-cap investors, which increases the number of potential buyers and makes share ownership more dispersed.
- Increase Stock Liquidity With an increase in the number of shares in circulation, buying and selling activity in the market has the potential to increase. This condition makes stocks more liquid, easier to trade, and reduces the risk of transaction difficulties, both for individual and institutional investors.
- Psychological Effects and Portfolio Diversification Stock splits often have a psychological effect because the share price looks more reasonable compared to similar issuers. In addition, the lower price makes it easier for investors to diversify their portfolios, so that the risk due to the allocation of too much funds in one stock can be minimized.
Issuers are companies or parties that officially issue and offer financial instruments in the capital market as a means of raising funds from investors.
What is a Reverse Stock Split?
A reverse stock split is a corporate action when a company combines several shares into one new share so that the number of outstanding shares decreases, while the price per share increases proportionally. This policy is the opposite of a regular stock split and is generally done without changing the market capitalization value of the company.
Characteristics of Reverse Stock Split
Here are some characteristics of a reverse stock split
- TotalShares Outstanding Reduced Reverse stock split directlyreduces the total shares outstanding in the market by combining several old shares into one new share.
- Share Price Increases Investors receive fewer shares, but the price per share increases proportionally to the reverse stock split ratio.
- Fixed Market Capitalization The market value of the company remains essentially unchanged as the increase in share price offsets the decrease in the number of shares.
- Meeting Stock Exchange Rules Reverse stock splits are often done to increase the share price to meet the minimum price limit set by the stock exchange in order to maintain listing status.
- This action is oftenperceived less positively by investors as it can be taken as an indication of performance pressure or weakened growth prospects.
Reverse stock splits generally trigger negative market sentiment, where stock prices tend to fall below their fundamental value in the short term.
Stock Split vs. Reverse Stock Split
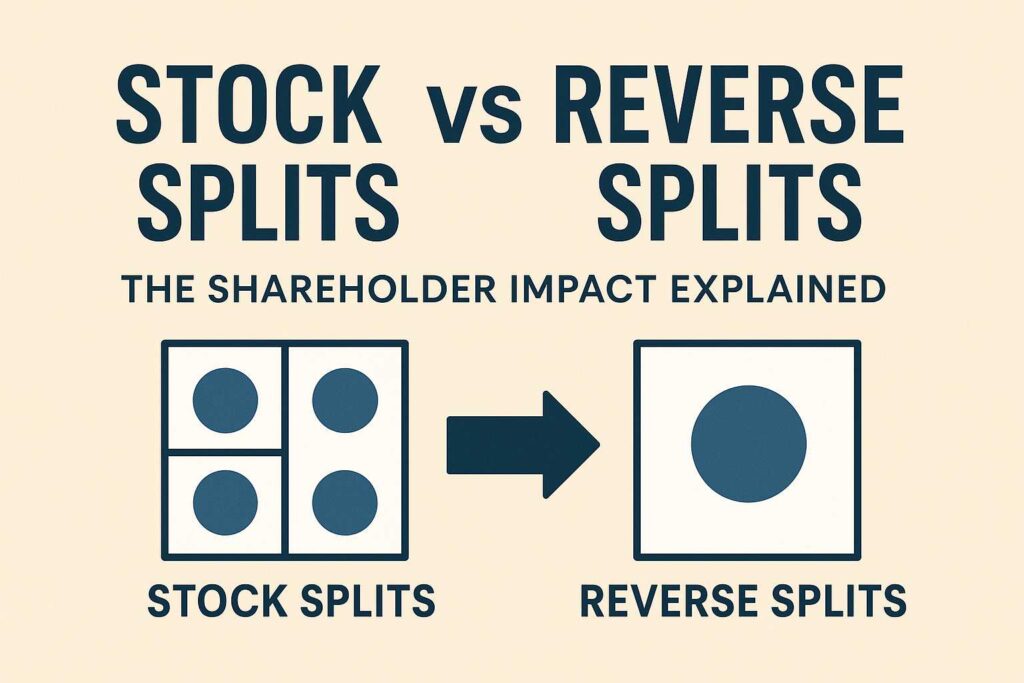
The following are the differences between a stock split and a reverse stock split:
| Aspects | Stock Split | Reverse Stock Split |
|---|---|---|
| Definition | A corporate action that divides shares into more units at a lower price per share without changing the total market value. | A corporate action that combines shares into fewer units at a higher price per share without changing the total market value. |
| Change in Number of Shares | Increase the number of shares outstanding in the market. | Reduce the number of shares outstanding in the market. |
| Change in Price Per Share | Lower the price per share according to the split ratio. | Increase the price per share according to the consolidated ratio. |
| General Purpose | Make stocks more affordable, attract retail investors, increase liquidity. | Increasing share prices that are too low to comply with stock exchange rules or improve market image. |
| Investor Perception | It is usually viewed positively as a sign of good company prospects.(IG) | Often viewed negatively as it is often associated with share price pressure or potential delisting.(FINRA) |
| Common Ratio Example | 2:1, 3:1, 10:1 (forward split). | 1:5, 1:10, 1:20 (reverse split). |
| Impact of Market Capitalization | Unchanged; total share value is the same before and after the action. | Unchanged; total share value is the same before and after the action. |
How to Calculate Stock Price After Stock Split
Calculating a stock split in company history is done by applying each stock split ratio sequentially to the initial number of shares. The number of shares will increase according to the split ratio, while the price per share adjusts inversely to keep the investment value and market capitalization the same.
Example of Walmart Stock Split in May 1971
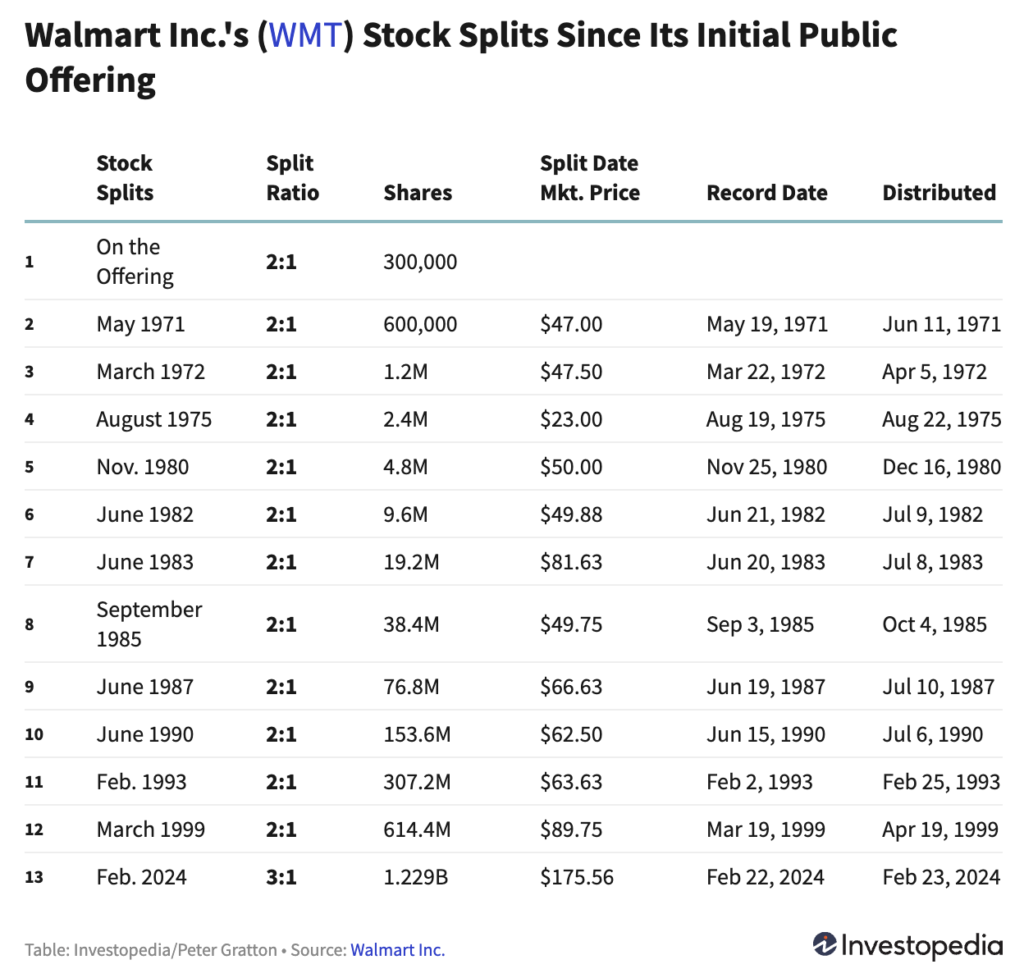
Suppose an investor owns Walmart stock before the stock split with the following conditions:
- Initial number of shares: 200 shares
- Market price before stock split: $47 per share
- Stock split ratio: 2:1
The calculation steps are as follows:
- Number of shares after stock split: 200 × 2 = 400 shares
- Share price after stock split: $47 ÷ 2 = $23.50 per share
- Investment value before stock split: 200 × $47 = $9.400
- Investment value after stock split: 400 × $23,50 = $9.400
This example shows that a stock split only changes the number of shares and the price per share, but does not change the total value of the investment held by investors.
NVIDIA Stock Split Example in 2024
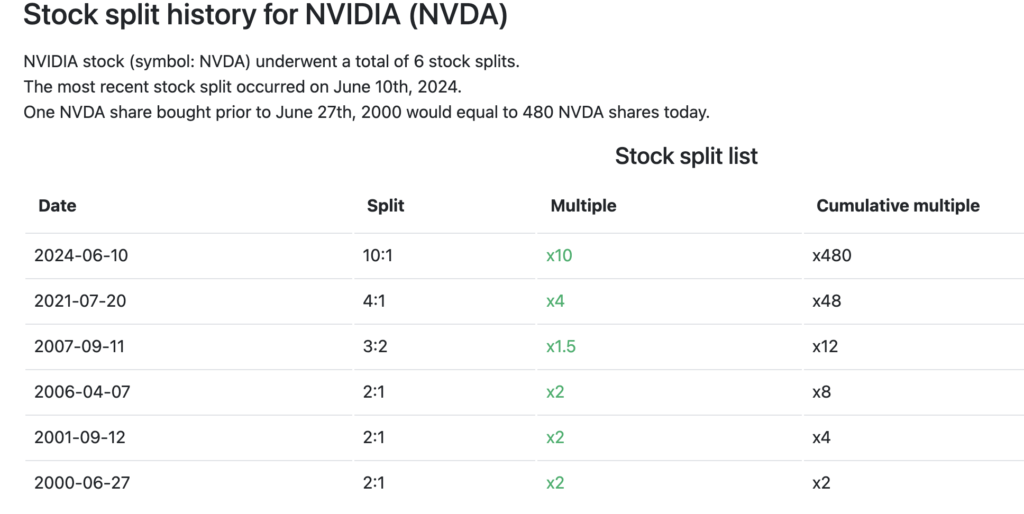
In June 2024, Nvidia Corp (NVDA) conducted a stock split at a ratio of 10:1. Before the action, Nvidia’s stock price was around $1,200 per share. After the stock split, the share price in early trading adjusted to around $120 per share.
With this ratio, investors who previously owned 1,000 shares will hold 10,000 shares, while the overall value of the company remains reflected by the market capitalization of over $3 trillion.
Throughout its journey as a public company since its IPO in 1999, Nvidia has conducted several stock splits, with a total of 6 forward stock splits. To find out the number of shares after a series of stock splits, all ratios need to be multiplied sequentially.
For example, in the 3:2 stock split in 2001, one share became 1.5 shares. If one Nvidia share was purchased before the first stock split, then after the 10:1 stock split in 2024, the holding would accumulatively equal 480 shares.
How Does the Stock Perform After Stock Split?
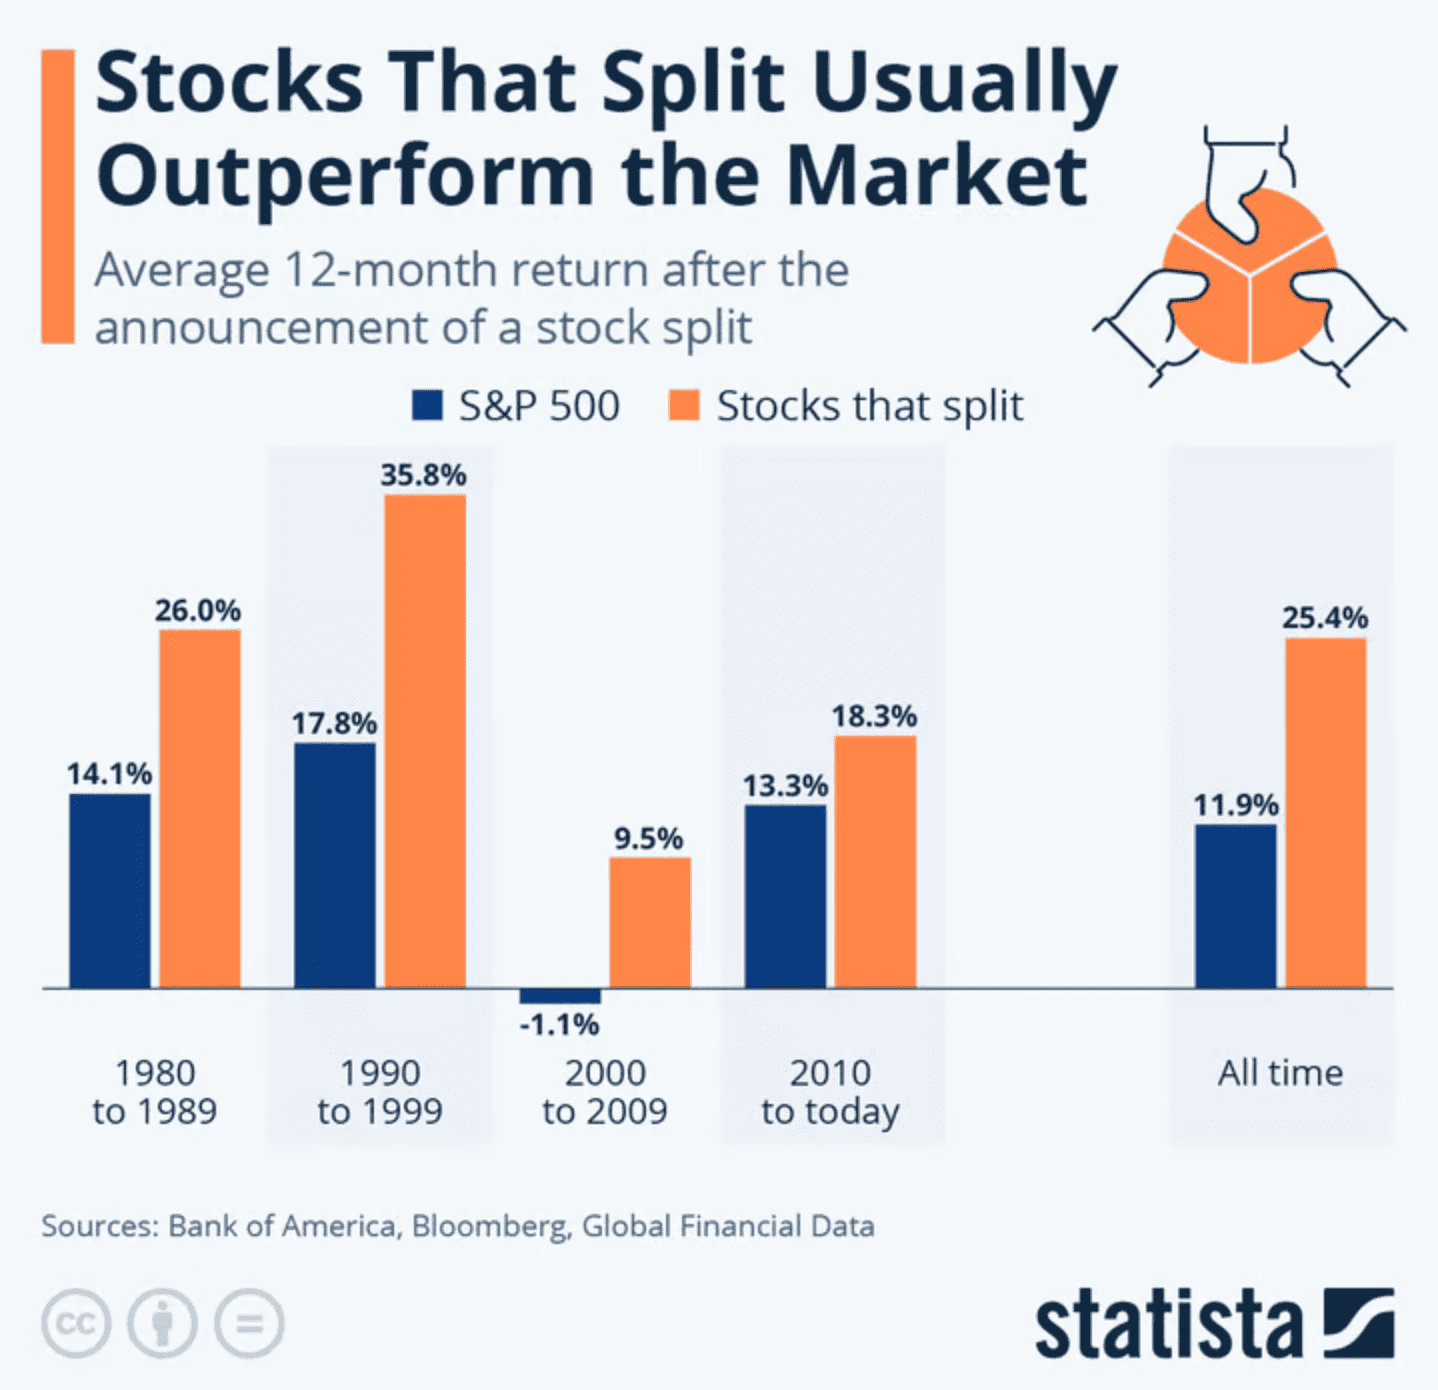
This data shows that stock splits tend to record higher 12-month average returns than the S&P 500 index. Over various time periods, from the 1980s to the present, stock splits have consistently outperformed the market, including over the long term, indicating a pattern of positive performance following stock split announcements.
Interestingly, in the 2000-2009 period when the market was under pressure, stocks that performed stock splits still generated positive returns, while the S&P 500 actually recorded a decline. This suggests that stock splits are often carried out by companies with relatively strong fundamentals and growth prospects, although it does not imply that stock splits are directly responsible for the increase in stock performance.
Benefits and Risks of Stock Splits for Companies and Investors
Stock splits are corporate actions that can have different impacts on companies and investors. Therefore, it is important to understand the benefits and risks involved, including whether a stock split benefits investors, before assessing its implications on stock performance and investment strategies.
Stock Split Advantages
- More Affordable Share Prices Stock splits are generally done when the share price is already relatively high, so the stock split makes the price per share cheaper and makes it easier for investors to buy a standard amount of shares.
- Increasingthe number of outstanding shares can encourage buying and selling activities, narrow the difference between buying and selling prices, and make shares easier to trade in the market.
- Attracting Investor Interest Stock splits often reignite investor attention and can have a positive impact on share prices in the short term, especially if done by large-cap companies.
- Management Confidence Signal This action is often seen as a form of management optimism about the company’s future growth prospects.
Stock Split Risk
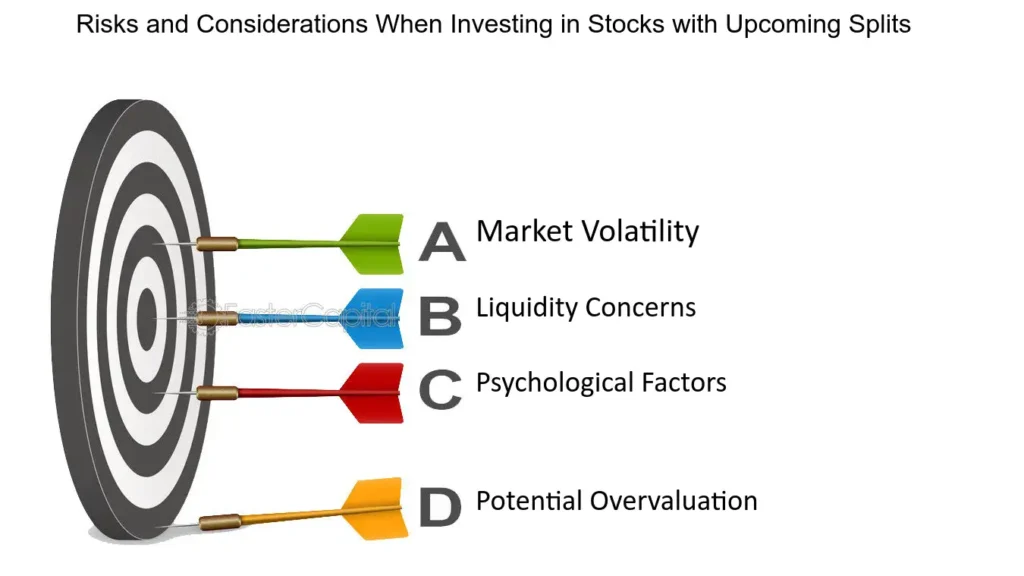
- Implementation Costs The stock split process entails administrative, legal, and communication costs to shareholders, which can be a burden especially for smaller companies.
- Potential for Higher Volatility Lower share prices have the potential to attract speculative activity, resulting in morevolatile price movements.
- Temporary Positive Impact The increase in price and trading volume after a stock split is often short-lived if not supported by strong fundamental performance.
- Reduced Benefits in the Era of Fractional Shares With the growing popularity of fractional share purchases, the function of stock splits to increase investor accessibility has become less significant.
- Perception of Financial Engineering Stock splits that are too frequent may be viewed as a cosmetic effort, rather than a reflection of real business growth.
Conclusion
Stock splits are technical corporate actions that do not change the fundamental value of the company or the value of investors’ investments, but play an important role in increasing the liquidity and affordability of stock prices. Historically, stock splits have often been responded positively by the market in the short term, although the impact is highly dependent on fundamental conditions and overall market sentiment.
For investors, a stock split is not a guarantee of profit, but rather a signal that needs to be analyzed alongside other factors such as financial performance, business prospects, and macroeconomic conditions. Therefore, a thorough understanding of the mechanisms, types, and risks of stock splits is key in developing a more rational and sustainable investment strategy.
Start Tokenized Stocks Investment on the Door!
Now that you understand the concept of stock splits, their impact on share prices, and the opportunities they present to investors, you can now access global stocks more flexibly through Tokenized Stocks on Pintu.
With Tokenized Stocks, investors can invest in top global stocks in the form of digital assets, without having to buy a whole stock, so that investment strategies can be tailored to their individual needs and risk profiles.
Here’s how to buy crypto assets on Pintu:
- Enter the Pintu homepage.
- Go to the Market Tokenized Stocks page .
- Search and select the crypto asset that you have analyzed before.
- Enter the amount you wish to purchase, and follow the rest of the steps.
Disclaimer: All articles from Pintu Academy are intended for educational purposes and do not constitute financial advice.
Reference:
- eToro Academy. A GUIDE TO STOCK SPLITS. Accessed December 17, 2025
- Investopedia. What a Stock Split Is, Why Companies Do It, and How It Works, With an Example. Accessed December 17, 2025
- SoFi. What Is a Stock Split? How Does It Affect Investors?. Accessed December 17, 2025
- The Motley Fool. Prediction: The Most-Anticipated Stock Split of the Fourth Quarter Will Be Announced This Month. Accessed December 17, 2025
- IG. Everything you need to know about stock splits and reverse stock splits. Accessed December 17, 2025
Share
Table of contents
Related Article

See Assets in This Article
0.0%
0.0%
0.0%
NVDAX Price (24 Hours)
Market Capitalization
-
Global Volume (24 Hours)
-
Circulating Supply
-