How to Spot Uptrend and Downtrend

In crypto trading, a trend is one of the most important elements in determining the direction of crypto price movement. By understanding the price trend, traders can make more optimal decisions to buy or sell an asset. In the following article, you can learn more about the concept of uptrend and downtrend in the crypto world. Starting from the definition, how it works, to how to utilize it as a trading strategy.
Article Summary
- ↕️ A price trend is an asset’s overall price movement direction. There are three price trends: uptrend, downtrend, and sideways.
- 📈 To draw a trend line, traders must connect at least two significant price points (highs and lows). Then, the line is drawn further to the right of the chart.
- 💪 The trend line will become stronger and more valid as it passes through more price action. Also, the more often the price tests the trend line that forms support and resistance, the stronger the trend line becomes.
- 👁️ By identifying price trends, traders can maximize profit opportunities. For example, going long when the price starts an uptrend or going short when the price trend reverses into a downtrend.
What is an Uptrend and Downtrend?
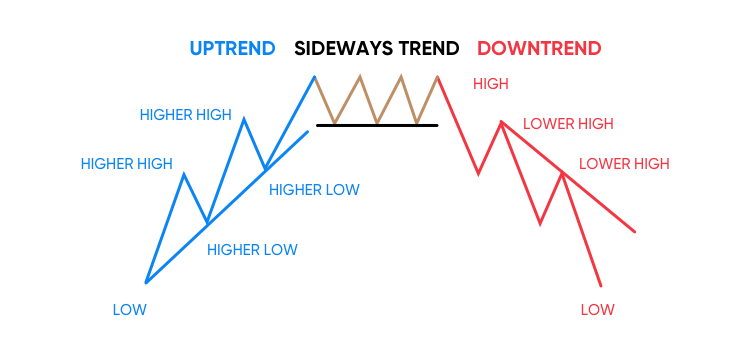
The term trend in trading refers to the overall price movement of an asset. There are three types of trends: uptrend, downtrend, and sideways.
An Uptrend is a pattern that shows higher highs and higher lows over a sustained duration. It shows an overall upward trend in prices. This can happen because of continuous buying that pushes the price up.
A Downtrend is the opposite of an uptrend, a pattern that shows lower highs and lower lows over a sustained period. It shows a downward price trend as a massive sell-off by traders triggers an ongoing correction.
A sideways is price movement within a limited range. This phase is characterized by volatile price movements, showing the asset does not yet have a clear trend.
Many factors can cause price movements and trend changes. These range from supply and demand factors, macroeconomics, market sentiment, and various news or events related to the asset.
Reading trends is very helpful in conducting technical analysis, learn about technical analysis here.
Trendlines and Channels
There are guidelines on drawing trend lines and channels to identify and confirm trend direction. Similarly, they can also be used to confirm the location of potential trend reversal points.
A simple rule traders should follow when drawing trend lines is connecting at least two significant price points (highs and lows). Then, the line is drawn further to the right of the chart. The presence of a third point can further validate the trend line.
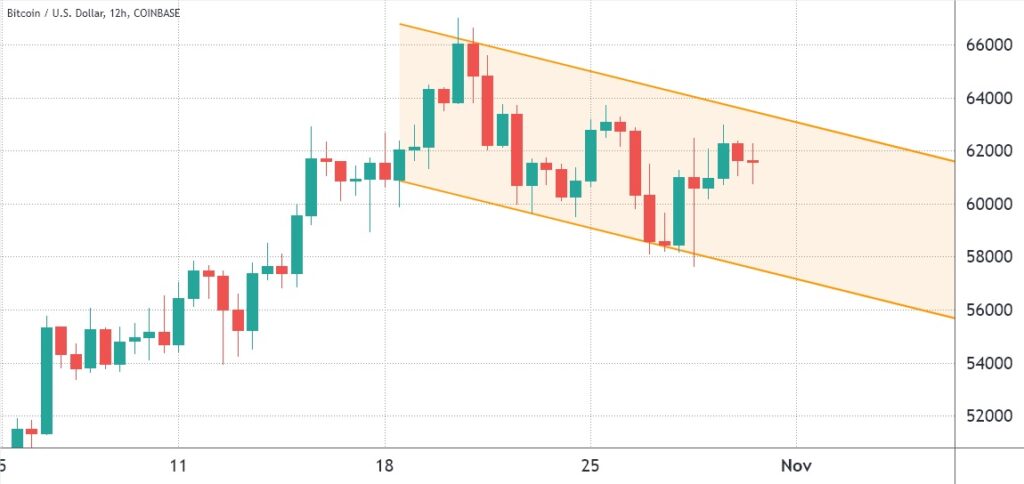
A channel shows support and resistance points over a period of time. It is created by drawing a connected line from highs to highs and lows to lows. If the price moves within the channel area, it’s considered a trend continuation. If the price moves above or below the channel, it can be interpreted as a trend reversal signal.
Ensure at least two connected price actions when drawing trend lines and channels. Use logarithmic scales for long-term charts, avoid trend lines or channels that are too steep, and don't draw trend lines or channels too far to the right of the chart.
How to Draw a Trendlines
Drawing trend lines is a technical analysis skill that can help you identify trend direction and reversal points. In drawing a trend line, traders must be observant in determining peaks and valleys. Here’s how to draw a trend line using technical analysis.
- How To Draw Uptrend
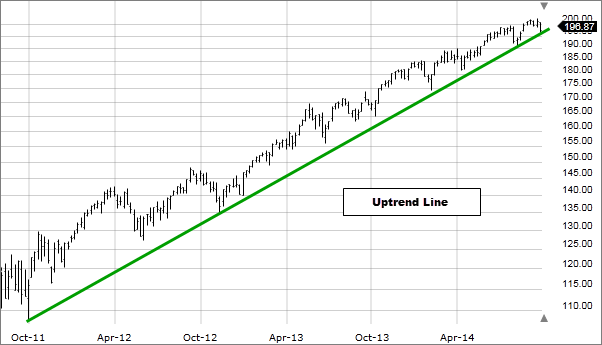
Draw a line based on price action that connects the higher high with the higher high on a chart that shows an uptrend phase. In drawing the line, make sure to draw in the valleys, not the other way around. The uptrend line can then serve as a support line. However, when the price drops past the line, it can signal a potential trend reversal.
- How to Draw Downtrend
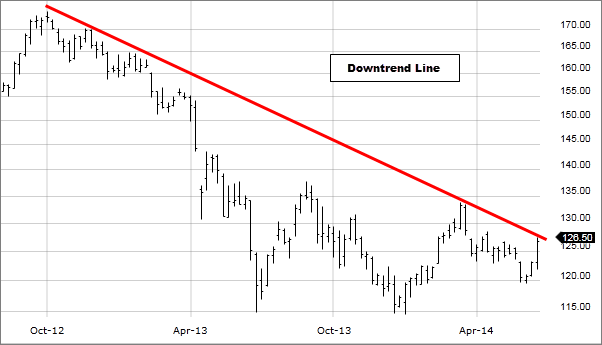
Similarly, creating a trend line on a downtrend chart must also be based on price action movements. Traders must connect the lower low point with the lower low end. In drawing the line, it is required that the peaks are receding. Thus, the trend line can also be used as a resistance line. So, when the price breaks the line, it can be understood as an opportunity for a trend reversal.
In drawing a trend line, it will become stronger and more valid as it crosses through more price action. Also, the more often the price tests the trend line that forms support and resistance, the stronger the trend line becomes.
Learn more about the role of support and resistance in trading in the following article.
Trading Strategy Using Uptrend and Downtrend
When deciding to trade based on a downtrend or uptrend, there are several steps that traders can take. Generally, the steps are to identify the trend, determine entry points, mitigate risk, and determine price targets. The following are the differences in how to trade based on downtrends and uptrends:
| Downtrend | Uptrend | |
| How to Trade | Place a short | Place a long |
| Identifying Trend | Series of lower highs and lower lows | Series of higher highs and higher lows |
| Entry Point | Look for divergence indicators or bearish reversal patterns (bearish engulfing, head & shoulder) | Early uptrend phase when the price experience a pullback |
| Risk Mitigation | Place a stop-loss order above the trendline (resistance line) | Place a stop-loss order below the trendline (support line) |
Trading downtrends and uptrends, both carry the risk that the prediction turns out to be wrong and the price reverses into a trend reversal.
If an asset is in a sideways phase, traders can wait and see first while waiting for a more evident price trend movement in the future.
However, finding entry and exit points for both uptrend and downtrend requires a combination of technical analysis, fundamentals, and market sentiment knowledge. Here are some steps that can be used in identifying these entry and exit points:
- Using technical analysis. In an uptrend, apart from looking for higher highs and higher lows, look for prices trading above the moving average. When the price stabilizes, use the pullback point as support and an entry point. In a downtrend, look for lower highs and lower lows, and the price trades below the moving average. When the price stabilizes, make the rebound point as resistance and an entry point.
- Using fundamental analysis. In an uptrend, you can look for positive news or developments related to the crypto project that might boost the price. For example, a long-awaited technology upgrade. While in a downtrend, negative news or problems with a crypto project can trigger a price correction. For example, there is a hack on a crypto project that impacts its prospects.
- Using market sentiment. During the uptrend phase, you can observe the positive sentiment. For example, there is an increase in trading volume, or the market is risk-on and looking for risky assets. These moments can be used as entry points. Conversely, if the trading volume decreases or the market switches to a safe haven, it can be used as an exit point.
Find out about other crypto asset investment strategies in this article.
Conclusion
Understanding the price trend of a crypto asset can help investors in making better investment decisions. Traders can utilize both uptrends and downtrends to generate profits despite a bullish or bearish market.
However, identifying uptrends and downtrends is not as easy as flipping a switch. It requires the ability to conduct technical analysis, as well as knowledge of fundamental conditions and market sentiment to draw a trend line. On the other hand, the risk of incorrect predictions and unpredictable market movements still looms.
Buy Crypto Assets in Pintu
Interested in investing in crypto assets? Take it easy, you can buy various crypto assets such as BTC, ETH, SOL, and others safely and easily. Furthermore, Pintu has subjected all its crypto assets to a thorough evaluation process, emphasizing the importance of prudence.
Pintu is also compatible with popular wallets such as Metamask to facilitate your transactions. Download Pintu app on Play Store and App Store! Your security is guaranteed because Pintu is regulated and supervised by Bappebti and Kominfo.
In addition to executing transactions, in the Pintu Apps, you can also learn more about crypto through various Pintu Academy articles updated weekly! All Pintu Academy articles are made for knowledge and educational purposes, not as financial advice.
Reference
Chip Stapleton, Trend: Definition, Types, Examples, and Uses in Trading, Investopedia, accessed on 3 May 2023.
Cory Mitchell, How to Spot and Trade Downtrends in Any Market, The Balance, accessed on 3 May 2023.
Coin Telegraph, Crypto charts 101: How to read cryptocurrency charts, accessed on 3 May 2023.
Babypips, What is an Uptrend? accessed on 3 May 2023.
Babypips, What is a Downtrend? accessed on 3 May 2023.
Share