Download Pintu App
Ethereum Skyrockets to $2,600 — But Could a Crash to $2,000 Be Next?
Jakarta, Pintu News – Ethereum (ETH) price is showing strength despite Bitcoin’s (BTC) brief decline today (28/5).
Is this false strength, or will ETH prices continue to rise? On closer inspection through technical analysis and on-chain data, there are clear signals that the market is starting to fatigue and could potentially fall to the $2,000 level.
Before discussing further, let’s explore Ethereum’s current price movements.
Ethereum Price Up 3.14% in 24 Hours
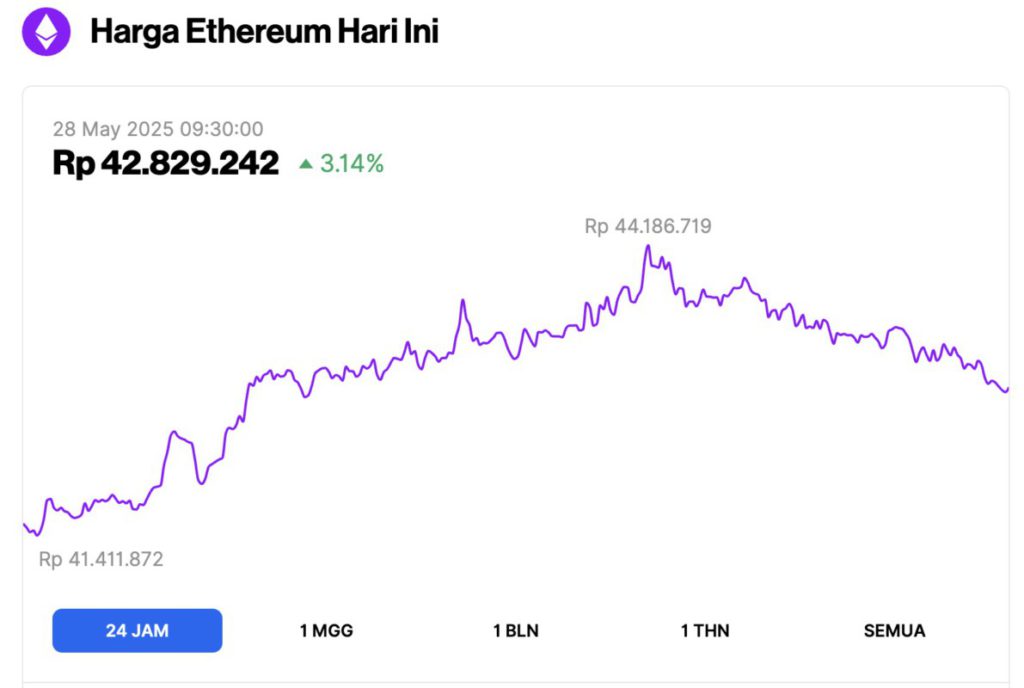
As of May 28, 2025, Ethereum (ETH) was trading at approximately $2,636, or around IDR 42,829,242 — marking a 3.14% gain over the past 24 hours. Within that timeframe, ETH dipped to a low of IDR 41,411,872 and climbed to a high of IDR 44,186,719.
At the time of writing, data from CoinMarketCap shows that Ethereum’s market capitalization stands at around $318.71 billion, with daily trading volume rising 64% to $24.07 billion in the last 24 hours.
Read also: Top 3 Altcoins to Watch This Week!
Sell Signal 1: Bearish Divergence Indicates Possible Retest to $2,000
In the daily chart (27/5), Ethereum price is moving in a range between $2,323 to $2,738, showing signs of uptrend exhaustion.
Although ETH printed almost the same highs in the last two weeks, momentum indicators such as RSI and AO are showing lower highs. This mismatch is called bearish divergence and indicates a potential short-term correction.
The Relative Strength Index (RSI) indicator recently dropped out of the overbought zone. The Awesome Oscillator (AO) indicator is also nearing the centerline with a diminishing red histogram – this signals weakening momentum, similar to what the RSI is showing.
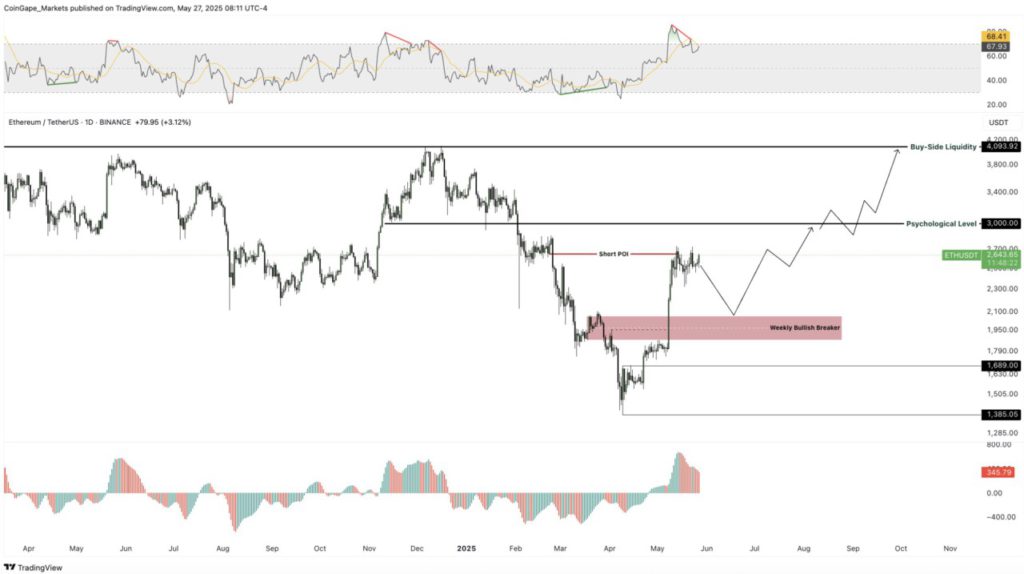
The chances of a price reversal are also quite high, given that ETH briefly touched the February 22 supply zone which is in the range of $2,800 to $2,600. In trading terms, a supply zone is an area where there was previously a large surge in sell orders that led to a sharp correction.
If the buying pressure is weak, a retest to this area usually results in a strong rejection.
An important level to watch if a correction does occur is the weekly bullish breaker zone which is in the range of $1,800 to $2,100. Given the bearish divergence, a retest to this area is highly likely.
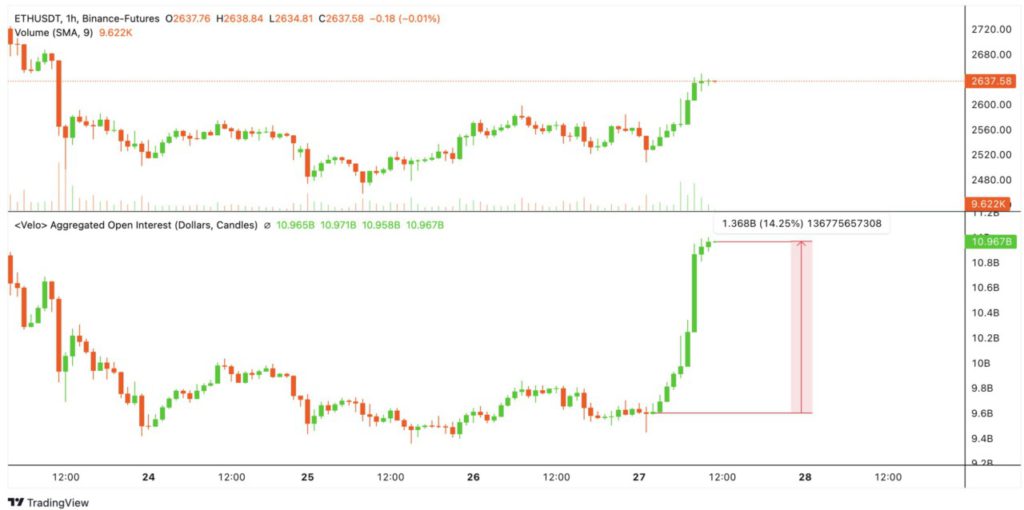
Sell Signal 2: Open Interest Up $1.36 Billion, Signaling High Leverage
With the $3,000 target only about a 13% increase away, the Open Interest (OI) for Ethereum jumped by $1.36 billion in just under nine hours.
While OI indicates investor interest, a sharp spike like this is a clear indicator of increased leverage usage. This rise in OI reflects increased speculation and risky exposure in the market.
Read also: Ethereum Smart Contracts Soar to 2021 Levels — Is a Massive Rally to $10,000 Next?
In general, when leverage increases over a short period of time, the market tends to experience a reversal in order to “clean out” the overly aggressive participants.
Therefore, this second sell signal also indicates that a drop in Ethereum price is highly likely in the near future.
Sell Signal 3: Profit Taking Potentially Triggers Correction
According to data from Santiment, Ethereum’s 30-day MVRV (Market Value to Realized Value) ratio currently stands at 24%, reflecting the average unrealized gains of ETH investors who bought a month ago.
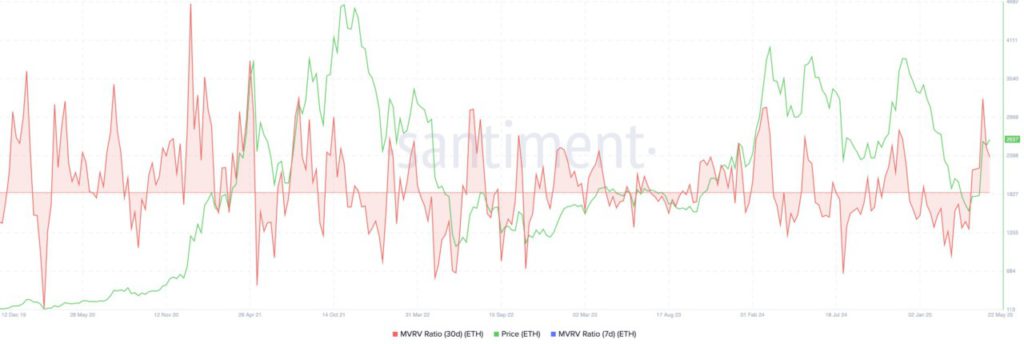
Usually, when this ratio enters the danger zone between 10% to 20%, the market tends to experience a reversal as investors start taking profits.
All in all, the potential for short-term profit-taking combined with the sharp spike in Open Interest indicates that Ethereum’s current price movement is already too high and loaded with leverage.
Both indicators reinforce the bearish divergence signal seen on the daily chart, and increase the likelihood of a price correction to the next important support level at $2,000.
That’s the latest information about crypto. Follow us on Google News to stay up-to-date on the world of crypto and blockchain technology.
Enjoy an easy and secure crypto trading experience by downloading Pintu crypto app via Google Play Store or App Store now. Get a web trading experience with advanced trading tools such as pro charting, various types of order types, and portfolio tracker only at Pintu Pro. Pintu Pro Futures is also available, where you can buy bitcoin leverage, trade btc futures, eth futures and sol futures easily from your desktop!
*Disclaimer
This content aims to enrich readers’ information. Pintu collects this information from various relevant sources and is not influenced by outside parties. Note that an asset’s past performance does not determine its projected future performance. Crypto trading activities have high risk and volatility, always do your own research and use cold cash before investing. All activities of buying and selling bitcoin and other crypto asset investments are the responsibility of the reader.
Reference:
- Coingape. Ethereum Price Forecast: Sell Signals Multiply, Hint Correction to $2,000. Accessed on May 28, 2025
Berita Terbaru
© 2026 PT Pintu Kemana Saja. All Rights Reserved.
Kegiatan perdagangan aset crypto dilakukan oleh PT Pintu Kemana Saja, suatu perusahaan Pedagang Aset Keuangan Digital yang berizin dan diawasi oleh Otoritas Jasa Keuangan serta merupakan anggota PT Central Finansial X (CFX) dan PT Kliring Komoditi Indonesia (KKI). Kegiatan perdagangan aset crypto adalah kegiatan berisiko tinggi. PT Pintu Kemana Saja tidak memberikan rekomendasi apa pun mengenai investasi dan/atau produk aset crypto. Pengguna wajib mempelajari secara hati-hati setiap hal yang berkaitan dengan perdagangan aset crypto (termasuk risiko terkait) dan penggunaan aplikasi. Semua keputusan perdagangan aset crypto dan/atau kontrak berjangka atas aset crypto merupakan keputusan mandiri pengguna.