Download Pintu App
Latest Analysis: Are Bitcoin, Ethereum, and Ripple About to Crash Hard?
Jakarta, Pintu News – As reported by FX Street (June 7), Bitcoin (BTC), Ethereum (ETH), and Ripple (XRP) showed signs of weakness in the middle of the week as bullish momentum faded.
BTC extended its decline and traded below $106,000, while ETH and XRP also dropped through their key support levels, raising concerns of a potential deeper correction in the near future.
Bitcoin price could experience further declines
The price of Bitcoin had jumped sharply by 7.32% last week and closed above $108,000. However, on Monday there was a correction (6/30), and the decline continued into the following day, closing below $106,000. As of July 2, the price of BTC was around $106,100.
Read also: Bitcoin Price Prediction in July 2025: Will BTC Surge?
If BTC continues to experience selling pressure and closes below the 50-day EMA at $104,245, the decline could continue until it hits the $100,000 psychological level.
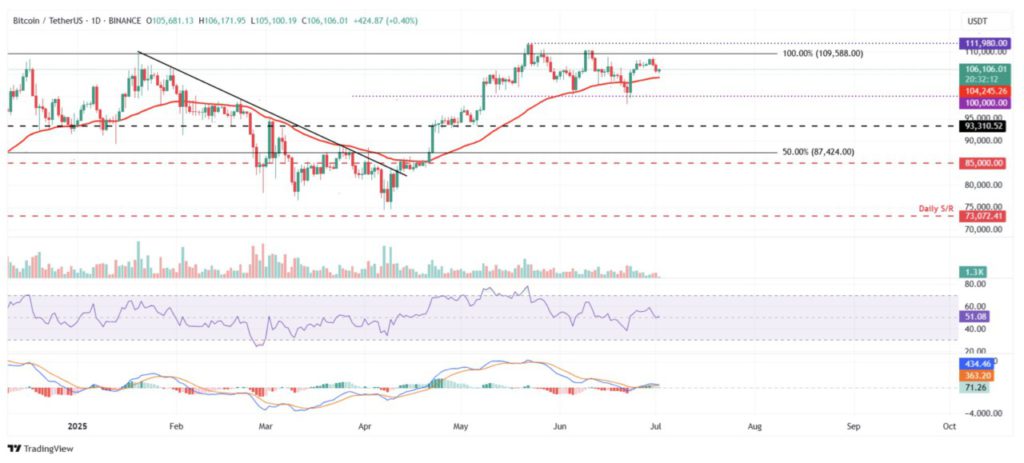
The Relative Strength Index (RSI) on the daily chart reads 51 and is around the neutral level of 50, reflecting indecision among traders. To maintain the bearish momentum, the RSI needs to move below the neutral level.
The Moving Average Convergence Divergence (MACD) indicator is also signaling a potential bearish crossover, where the MACD line is about to cross below the signal line. If this happens, a sell signal will appear.
However, if the 50-day EMA at $104,245 is able to hold as a strong support level, BTC has a chance to continue its rally towards the May 22 record high of $111,980.
Ethereum is in a Vulnerable Position to Experience a Pullback
Ethereum price failed to hold at the $2,461 daily level earlier this week and on Tuesday (July 1) closed below the 50-day Exponential Moving Average (EMA) at $2,428. As of Wednesday (2/7), ETH is still moving around the $2,428 mark.
If the correction continues, ETH could potentially extend its decline to retest the June 22 low of $2,111.
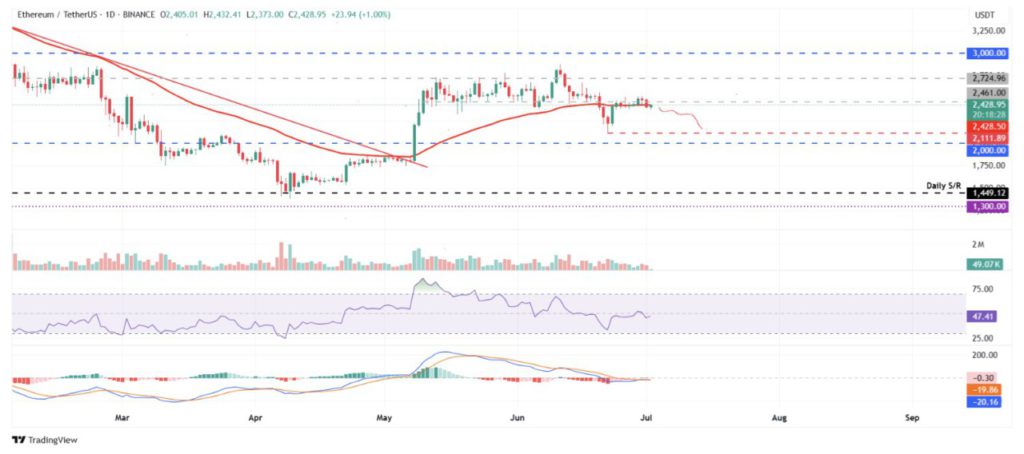
The Relative Strength Index (RSI) on the daily chart reads 47, below the neutral level of 50, indicating that bearish momentum is gaining strength. The Moving Average Convergence Divergence (MACD) indicator also shows both lines approaching each other, reflecting uncertainty among traders.
However, if ETH is able to recover and close above the $2,461 level, then the upside could continue towards the next daily resistance level of $2,724.
XRP Prepares to Resume Decline
The price of XRP did not manage to close above the daily resistance level of $2.23 on Monday (June 30), and experienced a decline of nearly 3% the next day. As of Wednesday (July 2), the price of XRP is moving around $2.18.
Read also: Ripple Price Prediction: Can XRP Reach $3 in July 2025?
If the correction continues, XRP could potentially extend its decline to test the next daily support at $1.96.
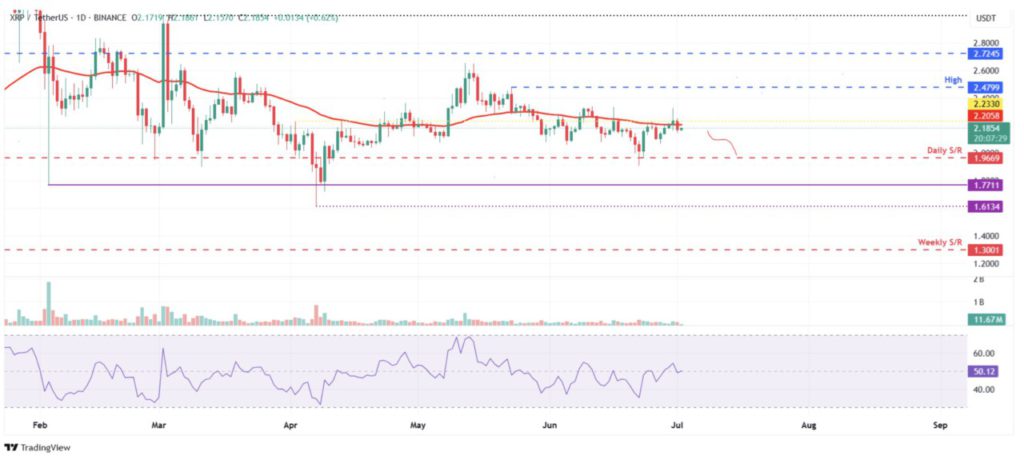
The Relative Strength Index (RSI) on the daily chart is around the neutral level of 50, reflecting uncertainty among traders. For the bearish momentum to continue, the RSI needs to drop below the neutral level.
Conversely, if XRP is able to recover and close above the daily resistance of $2.23, then the upside could continue towards the May 23 high of $2.47.
That’s the latest information about crypto. Follow us on Google News to stay up-to-date on the world of crypto and blockchain technology.
Enjoy an easy and secure crypto trading experience by downloading Pintu crypto app via Google Play Store or App Store now. Get a web trading experience with advanced trading tools such as pro charting, various types of order types, and portfolio tracker only at Pintu Pro. Pintu Pro Futures is also available, where you can buy bitcoin leverage, trade btc futures, eth futures and sol futures easily from your desktop!
- Disclaimer
This content aims to enrich readers’ information. Pintu collects this information from various relevant sources and is not influenced by outside parties. Note that an asset’s past performance does not determine its projected future performance. Crypto trading activities have high risk and volatility, always do your own research and use cold cash before investing. All activities of buying and selling bitcoin and other crypto asset investments are the responsibility of the reader.
Reference:
- FXStreet. Top 3 Price Prediction Bitcoin, Ethereum, Ripple: BTC, ETH, and XRP brace for correction. Accessed on July 3, 2025
Berita Terbaru
© 2026 PT Pintu Kemana Saja. All Rights Reserved.
Kegiatan perdagangan aset crypto dilakukan oleh PT Pintu Kemana Saja, suatu perusahaan Pedagang Aset Keuangan Digital yang berizin dan diawasi oleh Otoritas Jasa Keuangan serta merupakan anggota PT Central Finansial X (CFX) dan PT Kliring Komoditi Indonesia (KKI). Kegiatan perdagangan aset crypto adalah kegiatan berisiko tinggi. PT Pintu Kemana Saja tidak memberikan rekomendasi apa pun mengenai investasi dan/atau produk aset crypto. Pengguna wajib mempelajari secara hati-hati setiap hal yang berkaitan dengan perdagangan aset crypto (termasuk risiko terkait) dan penggunaan aplikasi. Semua keputusan perdagangan aset crypto dan/atau kontrak berjangka atas aset crypto merupakan keputusan mandiri pengguna.