Download Pintu App
Bitcoin Hits New All-Time High at $116,000 — Is This Just the Beginning of an Even Bigger Surge?
Jakarta, Pintu News – Bitcoin (BTC) price has just surged past $116,000, recording a new all-time high above its peak in May 2025.
But unlike before, the rally this time was driven by strong institutional support.
South Korean media outlet K Wave has reportedly acquired 88 BTC as part of its $1 billion cash plan.
The question now is – can the BTC price breakout this time avoid a similar fate as the meltdown to $98,000 in May? Let’s discuss the on-chain data and charts.
Exchange Inflows Decline; Where’s the Selling Activity?
According to data from CryptoQuant, Bitcoin inflows to exchanges plummeted to only around 3,200 BTC per day (at the time of writing), the lowest figure since 2015.
Read also: Crypto Bull Run Begins! Bitcoin, Ethereum, and XRP prices surge sharply!
For comparison, in December 2024 when the price of Bitcoin broke $100,000, this number had reached around 97,000 BTC.
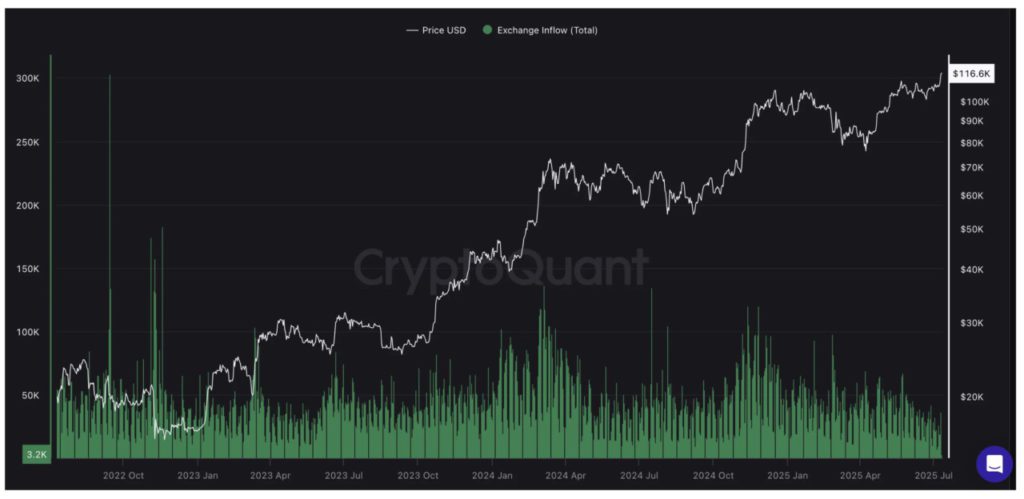
This is a very significant drop. Even at this new all-time high, coin holders do not seem to be moving their assets to exchanges – a clear signal that selling pressure is low and confidence in the asset remains high.
Inflows to the exchange track the number of coins sent to the trading platform, usually for sale.
The sharp decline in this metric signals a strong level of confidence: neither whales nor retail investors look intent on exiting, at least for now. And that in itself makes a sharp May-like downturn scenario less likely structurally.
Wallet Cluster Supports Bitcoin Price
Meanwhile, based on IntoTheBlock‘s In/Out of Money Around Price (IOMAP) metric, more than 645,000 addresses bought BTC in the price range of $108,795 to $110,624. This means that there are about 476,650 BTC stored near the current price level, forming a large demand wall.
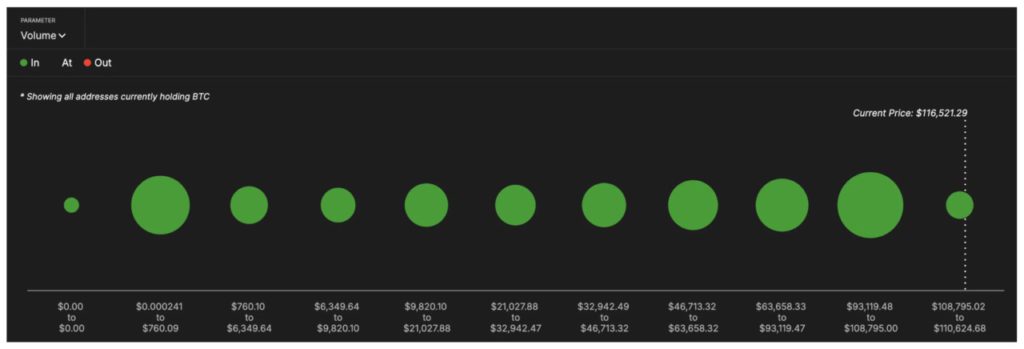
Back in May, the price collapsed as the support zone was quickly broken. This time, if Bitcoin stays above this address cluster, it signals that short-term buyers are still in a position to profit. This strengthens market confidence.
The IOMAP metric shows the position of previous purchases and whether the holders arein the money orout of the money.
When a large number of address clusters are within a certain price zone, the area usually serves as key support or resistance.
RSI divergence signals “caution,” but no panic yet
Next, on the risk side. While the price of BTC continues to print higher highs, the Relative Strength Index (RSI) is forming lower highs – this is a classic bearish divergence pattern. This is often the first sign of a price correction.
However, the current RSI is still below the overbought zone (below the 72 level), unlike last May when it spiked close to 80. This is the key difference – the divergence is there, but it hasn’t reached panic-inducing levels.
Read also: 3 Memecoins that skyrocketed after Bitcoin hit $116,000 today (11/7)!
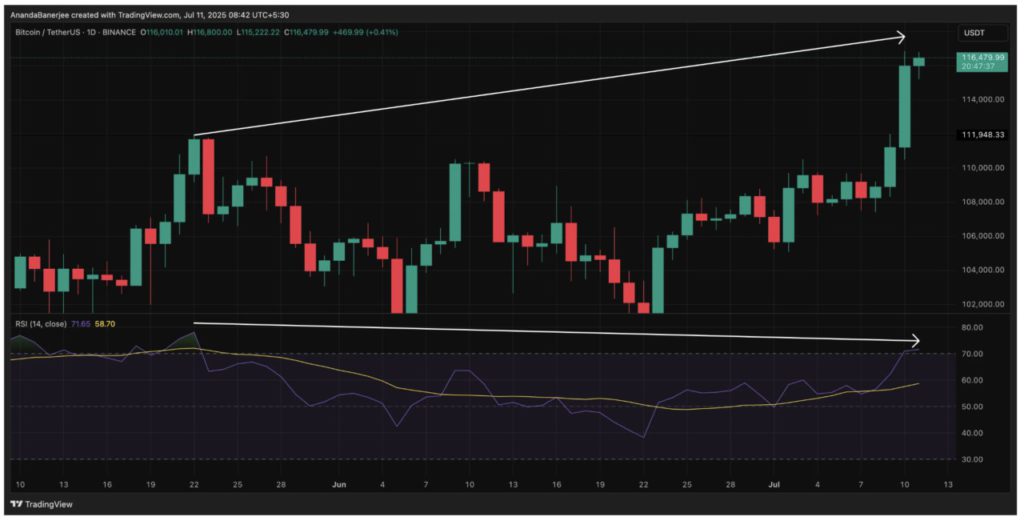
As such, a major correction seems unlikely in the near future, although a small retracement could be possible.
RSI tracks momentum. The divergence between the price and the RSI indicates weakening market confidence. But since it hasn’t entered the overbought zone yet, the current uptrend is still likely to continue.
Trend-Based Fibonacci Levels Offer Clear Upside Targets
With BTC re-entering the price discovery phase (no historical reference line), trend-based Fibonacci extensions were used to map out potential resistance levels.
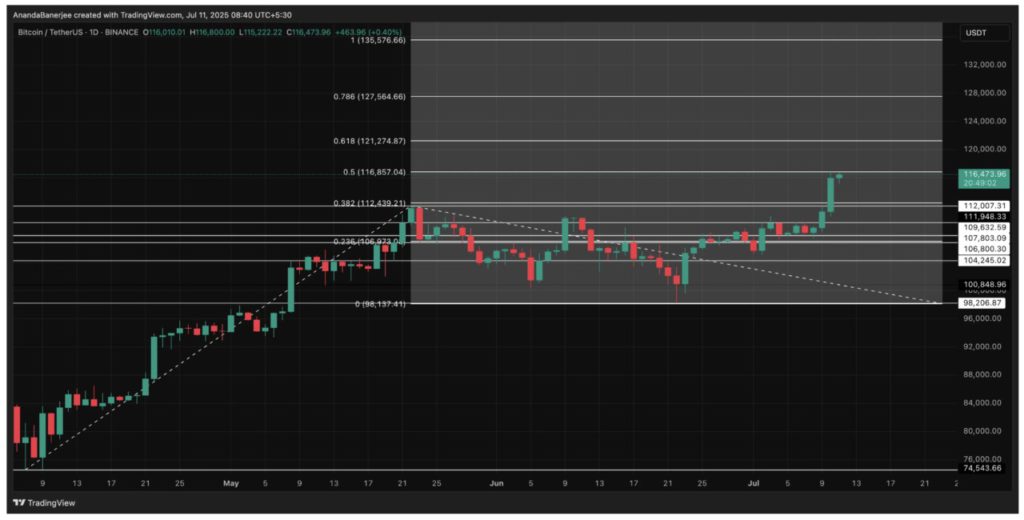
Calculated from the swing low of $74,543 to the May peak of $111,980, and taking into account the retracement to $98,000, the following resistance levels are obtained:
- 0.382 at $112,439
- 0.5 at $116,857
- 0.618 at $121,274
- 1.0 at $135,576
BTC’s recent price axis near $116,500 aligns with the 0.5 Fibonacci extension, suggesting that if the price manages to break this level, the path to $121,000 and $135,000 could be open. These levels serve as signposts for the direction of trend continuation – provided momentum is maintained.
Currently, Bitcoin is above its May peak, supported by low selling pressure, clear institutional buying, and a strong cluster of support. The Fibonacci roadmap indicates there is still room for further upside.
However, caution is still needed. RSI divergence has started to appear. If the price loses momentum and drops below $109.632 (one of the key support levels), then this breakout could turn into a retracement like the one in May, which would invalidate the bullish assumptions.
Let’s see if Bitcoin is able to turn this all-time high into the start of a sustained rally.
That’s the latest information about crypto. Follow us on Google News to stay up-to-date on the world of crypto and blockchain technology.
Enjoy an easy and secure crypto trading experience by downloading Pintu crypto app via Google Play Store or App Store now. Also, experience web trading with advanced trading tools such as pro charting, various types of order types, and portfolio tracker only at Pintu Pro. Pintu Pro Futures is also available, where you can buy bitcoin leverage, trade btc futures, eth futures and sol futures easily from your desktop!
*Disclaimer
This content aims to enrich readers’ information. Pintu collects this information from various relevant sources and is not influenced by outside parties. Note that an asset’s past performance does not determine its projected future performance. Crypto trading activities have high risk and volatility, always do your own research and use cold cash before investing. All activities of buying and selling bitcoin and other crypto asset investments are the responsibility of the reader.
Reference:
- BeInCrypto. Bitcoin (BTC) Hits New All-Time High, Can It Avoid Another Meltdown? Accessed on July 11, 2025
Berita Terbaru
© 2026 PT Pintu Kemana Saja. All Rights Reserved.
Kegiatan perdagangan aset crypto dilakukan oleh PT Pintu Kemana Saja, suatu perusahaan Pedagang Aset Keuangan Digital yang berizin dan diawasi oleh Otoritas Jasa Keuangan serta merupakan anggota PT Central Finansial X (CFX) dan PT Kliring Komoditi Indonesia (KKI). Kegiatan perdagangan aset crypto adalah kegiatan berisiko tinggi. PT Pintu Kemana Saja tidak memberikan rekomendasi apa pun mengenai investasi dan/atau produk aset crypto. Pengguna wajib mempelajari secara hati-hati setiap hal yang berkaitan dengan perdagangan aset crypto (termasuk risiko terkait) dan penggunaan aplikasi. Semua keputusan perdagangan aset crypto dan/atau kontrak berjangka atas aset crypto merupakan keputusan mandiri pengguna.