Download Pintu App
3 Cryptos Worth Buying During a Bullish Crypto Market
Jakarta, Pintu News – The crypto market is finally starting to show signs of revival. At the time of writing, the total crypto market capitalization is up by 2.68%, with the price of Bitcoin (BTC) sitting at $120,000 and Ethereum (ETH) surging to $3,500.
While large cryptocurrencies like Bitcoin and Ethereum dominate the headlines, a number of small-cap crypto assets have also started preparing for their big move.
If you’re looking for the best crypto to buy right now, here are three coins or tokens that are predicted to excel in the short term.
Optimism (OP): The Crypto “Dark Horse” that’s Ready to Speed Up?
Optimism (OP) seems to be starting to prove its name as one of the best cryptos to buy right now. In the last 24 hours, the token has gained about 10.5% and is trading in the $0.71 equivalent range.
Read also: Breaking a New Record High, XRP Price Predicted to Surge to $50!
Technically, OP is trying to break the resistance level at $0.723. If the price is able to hold above this level, then the next targets are around $0.844, $0.935, up to $1.044. These highs reflect a potential upside of around 40% from the current position – a very attractive prospect for short-term traders.
To make things more interesting, the breakout pattern of the descending wedge formation is starting to become visible on the daily chart. The descending wedge is often considered a classic bullish reversal pattern, and when combined with increased transaction volume, this signal becomes even more valid.
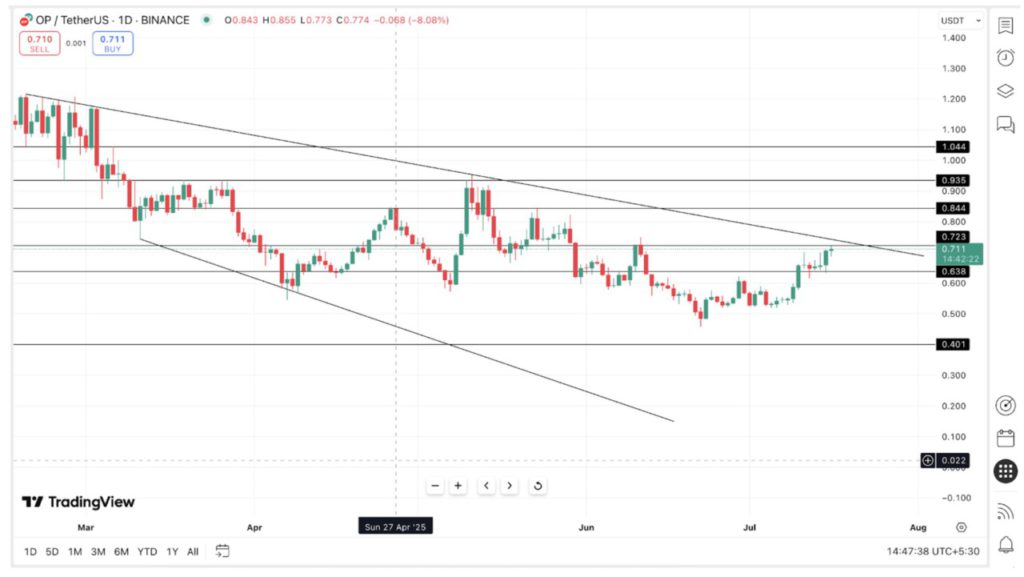
On the fundamental side, the DeFi sector on the Optimism network is also showing significant growth. The Total Value Locked (TVL) in the OP ecosystem jumped by almost 15% in the past month, placing Optimism in 17th place of the entire blockchain network in terms of DeFi activity. This fact provides strong support to OP’s ongoing price rally.
However, there is also a risky side. If OP fails to defend the support level around $0.638 and the selling pressure increases again, then this bullish setup could collapse. In a negative scenario, the price could potentially drop to the next support level around $0.401.
Optimism (OP) deserves to be on your radar, but keep an eye out for volatile market movements.
BONK: Solana’s Origin Coin Meme Ready to Explode Again?
Bonk, (BONK), the original meme coin of the Solana ecosystem, is stealing the market show. In the past month, the price of BONK surged by more than 110% and is currently trading in the equivalent range of $0.0000033. This surge is not just hype-BONK is starting to show signs of technical strengthening and solid volume support.
Based on Fibonacci extension analysis, BONK has broken the 1.0 level at $0.000002826 and is now aiming for the next targets at the 1,618 and 2,618 levels, which are around $0.000003868 and $0.000005554.
Read also: 3 Coin Season Meme Signals for a Big Comeback in July!
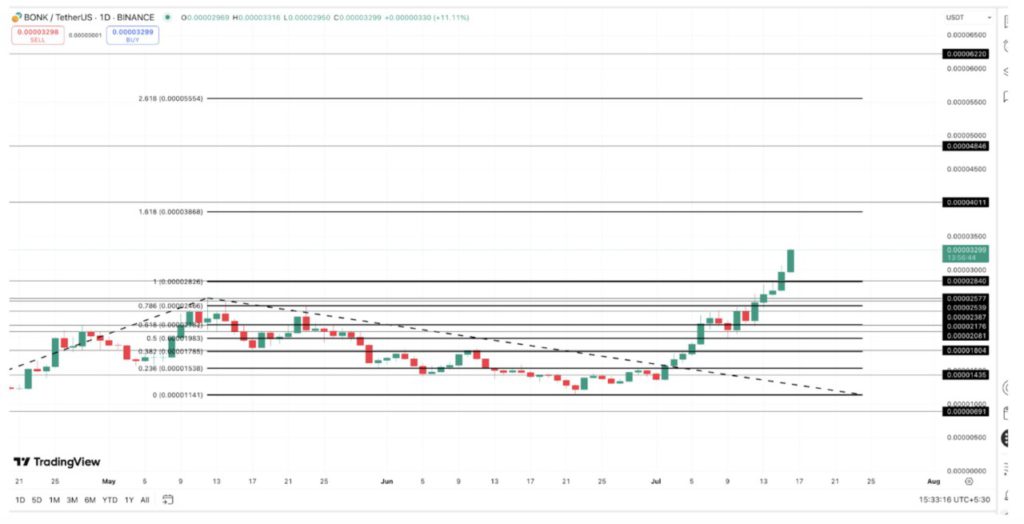
If this scenario is achieved, there is a potential upside of about 68% from the current price-a great opportunity for investors who like high-risk, high-yield assets.
BONK’s rise was also supported by whale accumulation. Data from Whale Radar shows large buying activity by several large crypto wallets.
Some wallets even reportedly added millions of BONK tokens to their portfolios this week, providing real volume support to the ongoing rally.
Moreover, BONK has just managed to break out of the downward trend of the past three months. This breakout turned a major resistance level into a new support area, a technical signal that usually indicates the entry of institutional investors or “strong hands” into the market.
As long as the buyers are able to defend this breakout area, the potential for a further rally is still very much open.
However, keep an eye out for a possible correction. If the price of BONK drops below the 0.618 Fibonacci retracement level around $0.000002182, the bullish scenario starts to weaken. In that case, the price could return to the consolidation area at $0.0000020.
BONK may be a meme coin, but its movement this time is not to be messed with. For investors who want to enter the crypto market in an aggressive style, BONK could be an interesting choice in the short term.
Solana (SOL): Quietly Ready to Explode? Here are the Early Signs
Solana (SOL) has not shown any major price spikes in recent days, but its technical chart is quietly forming a promising pattern.
SOL is currently trading around $167, just above the 0.382 Fibonacci level of $161-an important support point that could be the basis for the next bullish move.
If the price manages to break the 0.5 Fibonacci level around $172, then SOL has the potential to sprint towards the next target at $198, even up to 218, which is the projected 1.0 level of the current trend Fibonacci pattern. This opens up significant room for upside in the near future.
Read also: Analysts predict Solana could explode to $2,700, SOL ETF approval chance at 99%!
What makes this setup even more interesting is the movement of the exponential average indicator (EMA). Solana’s 20-day EMA has crossed above the 50-day EMA and the 100-day EMA-a strong signal known as a “golden crossover.”
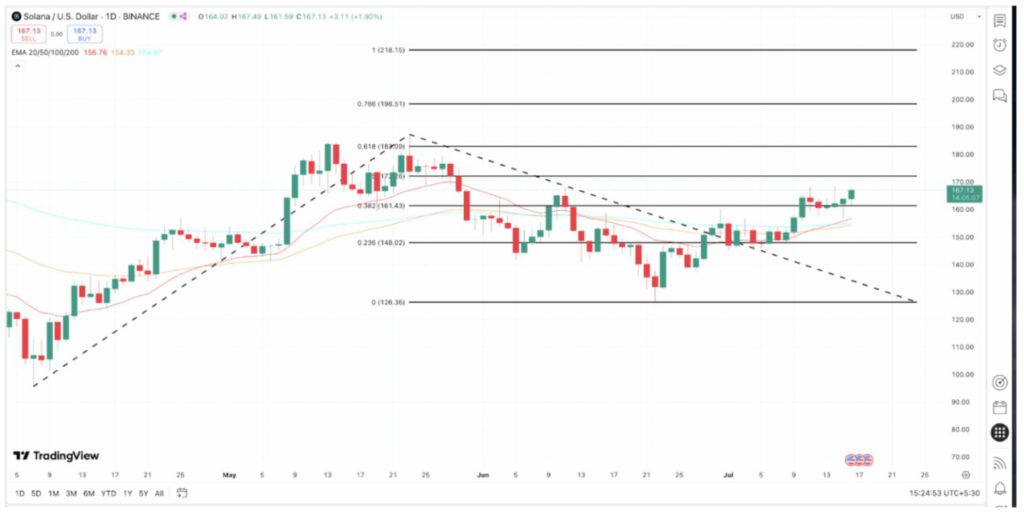
If the 50-day EMA also breaks through the 100-day EMA, it will form a rare formation called a triple golden crossover. This is one of the most bullish technical signals that momentum traders look for.
This triple crossover is rare and indicates that the short, medium, and long-term sentiments are all aligned in an upward direction. When all three EMAs move up together, it’s like all the green lights are on-a sign that buying pressure is dominant.
In terms of fundamentals, DeFi activity on the Solana network is also supporting price strength. Total Value Locked (TVL) in Solana’s DeFi ecosystem rose by more than 10% this month, signaling increased trust and adoption of the network.
However, there remains a risk of correction. If the SOL price drops below the 0.236 Fibonacci support around $148, the triple crossover formation will fail, and Solana could re-enter the medium-term downtrend phase.
For investors who carefully read technical and fundamental signals, Solana currently looks like a bullish time bomb waiting for momentum to explode.
That’s the latest information about crypto. Follow us on Google News to get the latest information about the world of crypto and blockchain technology. Check today‘ s bitcoin price, today‘ s solana price, pepe coin and other crypto asset prices through Pintu Market.
Enjoy an easy and secure crypto trading experience by downloading Pintu crypto app via Google Play Store or App Store now. Also, get a web trading experience with various advanced trading tools such as pro charting, various types of order types, and portfolio tracker only at Pintu Pro.
*Disclaimer
This content aims to enrich readers’ information. Pintu collects this information from various relevant sources and is not influenced by outside parties. Note that an asset’s past performance does not determine its projected future performance. Crypto trading activities have high risk and volatility, always do your own research and use cold cash before investing. All activities of buying and selling bitcoin and other crypto asset investments are the responsibility of the reader.
Reference:
- Coin Republic. Best Crypto To Buy Now As the Market Recovers: Top 3 Picks. Accessed on July 18, 2025
Berita Terbaru
© 2026 PT Pintu Kemana Saja. All Rights Reserved.
Kegiatan perdagangan aset crypto dilakukan oleh PT Pintu Kemana Saja, suatu perusahaan Pedagang Aset Keuangan Digital yang berizin dan diawasi oleh Otoritas Jasa Keuangan serta merupakan anggota PT Central Finansial X (CFX) dan PT Kliring Komoditi Indonesia (KKI). Kegiatan perdagangan aset crypto adalah kegiatan berisiko tinggi. PT Pintu Kemana Saja tidak memberikan rekomendasi apa pun mengenai investasi dan/atau produk aset crypto. Pengguna wajib mempelajari secara hati-hati setiap hal yang berkaitan dengan perdagangan aset crypto (termasuk risiko terkait) dan penggunaan aplikasi. Semua keputusan perdagangan aset crypto dan/atau kontrak berjangka atas aset crypto merupakan keputusan mandiri pengguna.