Download Pintu App
3 Bullish Pi Network (PI) Patterns that Show Possible Reversal
Jakarta, Pintu News – The cryptocurrency market is always full of unexpected dynamics. Recently, Pi Coin has been showing some signals that may indicate a bullish reversal is imminent. Various technical indicators are starting to show signs of buyer strength that might change the direction of the current trend.
Check out the full analysis in this article!
Volume Shows Strength: OBV Shows Increase
The On-Balance Volume (OBV) indicator has started to show early signs of bullish intentions. Between July 13 and 22, Pi Coin’s price experienced a significant increase, and the OBV followed suit by registering higher highs.
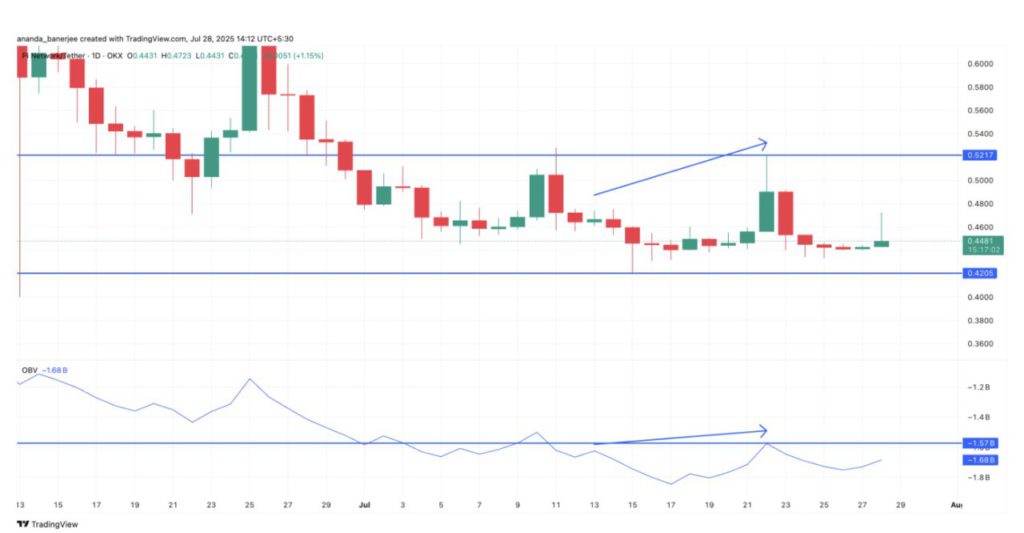
This simultaneous increase in price and volume indicates that the price spike was not just a fluke, but was backed by real buying volume. However, this strength still requires further validation.
To confirm trend continuation, the OBV must cross the previous peak at -1.57 billion. A higher high on the OBV would signal continued accumulation, strengthening the case for a broader bullish reversal.
Read also: Price of 1 Pi Network (PI) in Indonesia Today (7/29/25)
RSI Divergence Supports OBV Momentum
The Relative Strength Index (RSI) is also showing signs of revival. Although Pi Coin’s price continues to print lower highs, the RSI is moving in an upward trajectory. This bullish divergence indicates that bearish pressure is starting to wane; a divergence between price and underlying strength.
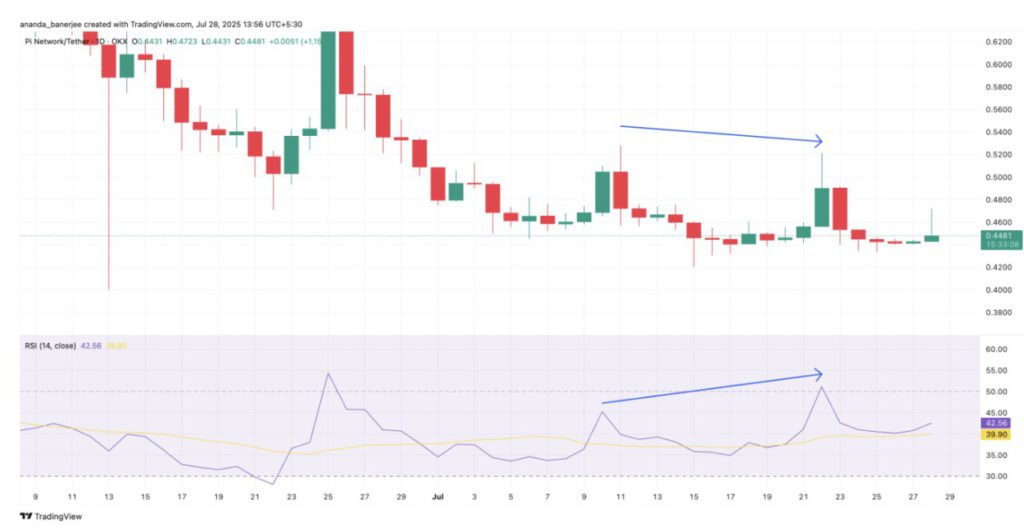
However, for this signal to strengthen, the RSI must cross the 52 level. A close above 52 would imply that bullish momentum has not only emerged, but also broken through.
Until that happens, this divergence remains promising, but unconfirmed. A move above 52 would signal the formation of two higher highs, indicating bullishness similar to a reversal.
Also read: Gold Jewelry Price Today, Tuesday July 29, 2025
Candlestick Confirmation: Inverted Hammer Adds Weight to Pi Price Reversal!
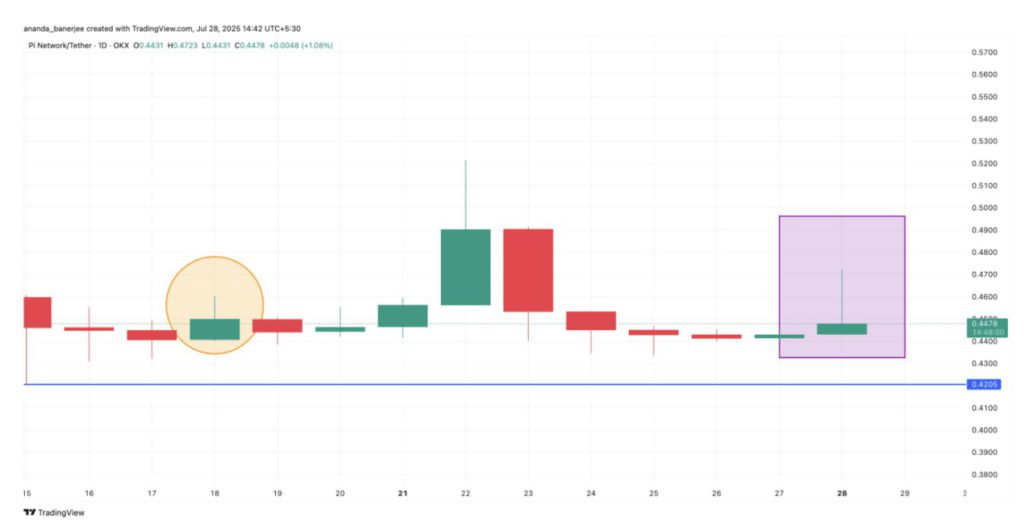
The last bullish signal came from a candlestick pattern. On July 28, Pi Coin printed a green inverted hammer, a candlestick with a small real body near the low and a long upper wick, indicating a failed breakout or resistance test.
This pattern usually appears after a downward trend, signaling a potential bullish reversal, but only if confirmed by the next strong candle. Although buyers pushed the price sharply higher within the day, they were unable to sustain those gains.
However, the close above the open (green body) suggests some intraday strength. What matters now is confirmation: a solid green candle that breaks above the high wick. Without that, this remains just a potential reversal, not a definite one.
Conclusion
With the combination of rising OBV, RSI divergence, and inverted hammer, Pi Coin shows potential for a reversal. However, confirmation remains key. If Pi Coin’s price can break above the $0.47 mark (0.5 Fibonacci retracement), then a test back to $0.52 seems possible.
On the other hand, a close below $0.44, the 0.786 Fibonacci extension, would derail this bullish structure. Until then, traders may want to stay alert for confirmation before positioning too aggressively.
That’s the latest information about crypto. Follow us on Google News to get the latest information about the world of crypto and blockchain technology. Check today‘ s bitcoin price, today’s solana price, pepe coin and other crypto asset prices through Pintu Market.
Enjoy an easy and secure crypto trading experience by downloading Pintu crypto app through Google Play Store or App Store now. Also, get a web trading experience with various advanced trading tools such as pro charting, various types of order types, and portfolio tracker only at Pintu Pro.
*Disclaimer
This content aims to enrich readers’ information. Pintu collects this information from various relevant sources and is not influenced by outside parties. Note that an asset’s past performance does not determine its projected future performance. Crypto trading activities have high risk and volatility, always do your own research and use cold cash before investing. All activities of buying and selling bitcoin and other crypto asset investments are the responsibility of the reader.
Reference
- BeInCrypto. Pi Coin Price: Bullish Patterns Reversal. Accessed on July 29, 2025
- Featured Image: Coin Central
Berita Terbaru
© 2026 PT Pintu Kemana Saja. All Rights Reserved.
Kegiatan perdagangan aset crypto dilakukan oleh PT Pintu Kemana Saja, suatu perusahaan Pedagang Aset Keuangan Digital yang berizin dan diawasi oleh Otoritas Jasa Keuangan serta merupakan anggota PT Central Finansial X (CFX) dan PT Kliring Komoditi Indonesia (KKI). Kegiatan perdagangan aset crypto adalah kegiatan berisiko tinggi. PT Pintu Kemana Saja tidak memberikan rekomendasi apa pun mengenai investasi dan/atau produk aset crypto. Pengguna wajib mempelajari secara hati-hati setiap hal yang berkaitan dengan perdagangan aset crypto (termasuk risiko terkait) dan penggunaan aplikasi. Semua keputusan perdagangan aset crypto dan/atau kontrak berjangka atas aset crypto merupakan keputusan mandiri pengguna.