Download Pintu App
Ripple (XRP) Price Drop Analysis, Here’s the Potential Support & Resistance! (10/10/25)
Jakarta, Pintu News – The price of Ripple (XRP) experienced a sharp drop below $2.90, indicating the potential for further declines if it is unable to maintain critical support. After failing to hold above $3.00, Ripple (XRP) is now in a bearish zone that may worsen market conditions if this trend continues.
Ripple (XRP) Price Drop Analysis
Ripple (XRP) started its decline by breaking below $2.95 and $2.92, which marked the beginning of a short-term bearish zone. This decline coincided with Bitcoin (BTC) and Ethereum (ETH) price drops, indicating a broader negative trend in the crypto market.
The price of Ripple (XRP) attempted a recovery, but stalled near $2.92, showing that selling pressure is still very strong. After failing to break the $2.92 resistance level, the price of Ripple (XRP) moved below $2.90 and the 100-hour simple moving average again.
There is a bearish trend line forming with resistance at $2.88 on the hourly chart of the XRP/USD pair. If the price tries to go up again, it will likely face strong resistance at this level before it can try to break higher.
Also Read: Trump’s Secret Plan May Push Bitcoin (BTC) to $250,000!
Potential Resistance and Support
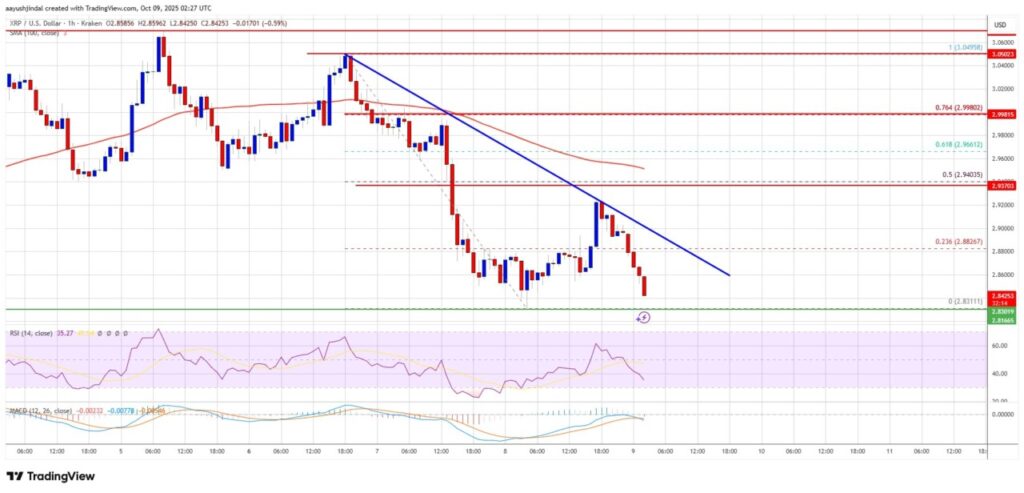
If Ripple (XRP) manages to break to the upside, the first resistance it will face is at $2.88. If it manages to cross that, the next resistance is $2.92. A break above this level could push the price towards $2.95 and then to $3.00, which is the 76.4% Fib retracement of the last drop from $3.05 to $2.8320.
However, the main obstacle for the bulls is at $3.05, which if reached, could signal a change in trend. However, if Ripple (XRP) is unable to break the $2.92 resistance zone, the price could drop again. Initial support lies at $2.82, followed by critical support at $2.80. A break below could trigger a further drop towards $2.7250, and if the selling pressure persists, the price could drop all the way to the $2.65 or even $2.60 zone.
Technical Indicators and Future Projections
The hourly MACD (Moving Average Convergence Divergence) indicator for Ripple (XRP) shows acceleration within the bearish zone, signaling that the downward momentum is still strong. Meanwhile, the hourly RSI (Relative Strength Index) is below the 50 level, indicating that the bears still have control of the market.
With technical conditions trending bearish, investors and traders should be wary of further downside potential. Close scrutiny of support and resistance levels will be key to navigating this volatile market. Investment decisions should be based on careful analysis and continuous monitoring of market indicators.
Conclusion
In the current market conditions, Ripple (XRP) is showing not encouraging signs with the potential for further decline. Investors should weigh the risks and set their strategies carefully to avoid unwanted losses. Monitoring support and resistance levels and technical indicators will be crucial in the coming days.
Also Read: 5 Robert Kiyosaki Predictions: USD Crashes & Crypto is Bought, Bitcoin Price Breaks Rp2 Billion!
Follow us on Google News to get the latest information about the world of crypto and blockchain technology. Check today‘ s bitcoin price, today’s solana price, pepe coin and other crypto asset prices through Pintu Market.
Enjoy an easy and secure crypto trading experience by downloading Pintu crypto app via Google Play Store or App Store now. Also, get a web trading experience with various advanced trading tools such as pro charting, various types of order types, and portfolio tracker only at Pintu Pro.
*Disclaimer
This content aims to enrich readers’ information. Pintu collects this information from various relevant sources and is not influenced by outside parties. Note that an asset’s past performance does not determine its projected future performance. Crypto trading activities are subject to high risk and volatility, always do your own research and use cold hard cash before investing. All activities of buying andselling Bitcoin and other crypto asset investments are the responsibility of the reader.
Reference
- NewsBTC. XRP Price Slips Lower to $2.90. Accessed on October 10, 2025
Berita Terbaru
© 2026 PT Pintu Kemana Saja. All Rights Reserved.
Kegiatan perdagangan aset crypto dilakukan oleh PT Pintu Kemana Saja, suatu perusahaan Pedagang Aset Keuangan Digital yang berizin dan diawasi oleh Otoritas Jasa Keuangan serta merupakan anggota PT Central Finansial X (CFX) dan PT Kliring Komoditi Indonesia (KKI). Kegiatan perdagangan aset crypto adalah kegiatan berisiko tinggi. PT Pintu Kemana Saja tidak memberikan rekomendasi apa pun mengenai investasi dan/atau produk aset crypto. Pengguna wajib mempelajari secara hati-hati setiap hal yang berkaitan dengan perdagangan aset crypto (termasuk risiko terkait) dan penggunaan aplikasi. Semua keputusan perdagangan aset crypto dan/atau kontrak berjangka atas aset crypto merupakan keputusan mandiri pengguna.


