Download Pintu App
5 Important Signals of ETH Decline & Potential Price Increase Amid Market Correction
Jakarta, Pintu News – Ethereum (ETH) has entered a correction phase after a rally that took the price through $3,350 and reached a local peak of $3,448. According to a report by NewsBTC, selling pressure below $3,450 triggered price weakness, putting ETH under threat of a deeper drop towards the support zone that market participants are now eyeing. This raises the question of whether the current weakness is the first sign of a trend reversal.
1. Impressive Rise Ends in Strong Selling Pressure
NewsBTC reported that Ethereum managed to maintain its position above $3,200 before embarking on a rally that surpassed Bitcoin (BTC) and broke the $3,320 to $3,350 resistance level. The rise signaled market forces that briefly pushed the price through some important technical barriers, thus creating short-term bullish momentum. However, this rally was arrested just below $3,450.
According to the same report, selling pressure in the area pushed ETH to correct again. The peak at $3,448 was the upper limit before the price reversal occurred. This pattern shows weak buying interest as the price approaches major resistance that has been breaking upside attempts.
Also Read: 5 Strong Signals from Dogecoin: Price Resilience, New Adoptions, to $1 Potential!
2. Correction Breaks Trend Support and Tests 100-Hour SMA
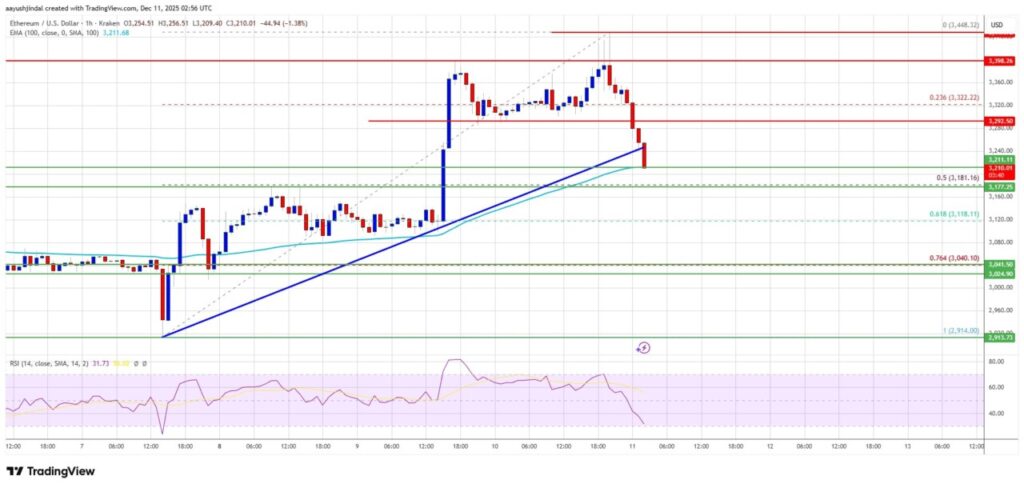
According to NewsBTC data, after the peak was formed, ETH experienced a sharp decline until it broke the bullish trend line on the hourly chart of ETH/USD at around $3,240. This breach of the trend structure is considered an early signal of deeper weakness technically. The change in structure marks a shift in dominance from buyers to sellers.
Ethereum is now trading near $3,200 and close to the 100-hour Simple Moving Average (SMA), which is an important point to assess whether the correction momentum continues. If ETH fails to hold above this area, selling pressure could push the price to the next support level. This increases the probability of a short-term downtrend forming.
3. Layered Resistance Limits Chances of Recovery
According to NewsBTC, if Ethereum attempts a rebound, the first obstacle will be at $3,250. This level is the initial test of whether buyers still have the strength to withstand the pressure. The next resistance is at $3,300, which also serves as a key limit before ETH can again target $3,320. The technical structure confirms that this area is a pivot point that determines the next price direction.
If ETH is able to break $3,320, the opportunity to move back towards $3,400 or even retest $3,450 becomes more open. However, NewsBTC emphasizes that failure to break $3,250 could extend the correction phase. This puts ETH in a vulnerable position to resume its decline in the next few sessions.
4. Key Supports at $3,180, $3,150, and Downside Risk to $3,050
NewsBTC’s report confirms that the main support now being monitored is $3,180. This zone is the first barrier to a potential deeper drop. If selling pressure continues to increase, ETH could move towards the next support at $3,150 which has historically been a consolidation point several times in previous trends.
In a continued bearish scenario, NewsBTC highlights the $3,050 level as the next target. A drop towards this area would signal a complete loss of the short-term bullish structure. As such, the price dynamics around these three support levels will be a decisive indicator of the trend direction in the near future.
5. Technical Indicators Reinforce Bearish Sentiment
According to technical analysis quoted by NewsBTC, the hourly MACD for the ETH/USD pair is now showing increasing bearish signals. The MACD line is moving deeper in the negative zone, signaling a dominant selling momentum. This confirms the pressure that has been seen on the price structure.
The hourly RSI is also below the 50 zone, emphasizing the weak buying strength in the market. With both leading indicators aligned in a bearish sentiment, the chances of further declines become greater. Traders and analysts are now monitoring whether the indicators could reverse in the near future as a sign of potential price stabilization.
Also Read: 5 Highlights of TRUMP Meme Coin’s $1 Million Game Campaign: New Strategy to Boost Token Value?
Follow us on Google News to get the latest information about crypto and blockchain technology. Check Bitcoin price today, Solana price today, Pepe coin and other crypto asset prices through Pintu Market.
Enjoy an easy and secure crypto trading experience by downloading Pintu crypto app via Google Play Store or App Store now. Also, get a web trading experience with various advanced trading tools such as pro charting, various types of order types, and portfolio tracker only at Pintu Pro.
*Disclaimer
This content aims to enrich readers’ information. Pintu collects this information from various relevant sources and is not influenced by outside parties. Note that an asset’s past performance does not determine its projected future performance. Crypto trading activities are subject to high risk and volatility, always do your own research and use cold hard cash before investing. All activities of buying andselling Bitcoin and other crypto asset investments are the responsibility of the reader.
FAQ
What is Ethereum (ETH)?
Ethereum (ETH) is a blockchain platform for decentralized applications and digital assets used as a medium for transactions and payment of network fees.
How has Ethereum’s price moved recently?
According to NewsBTC, Ethereum rose as high as $3,448 before correcting to around $3,200 after selling pressure intensified.
What caused ETH’s correction from its peak?
The report noted that selling pressure below $3,450 triggered the decline, plus the loss of bullish trendline support around $3,240.
What are the most important support levels being monitored right now?
Critical supports are at $3,180 and $3,150, with $3,050 being the next correction target if the selling pressure continues.
Why are MACD and RSI indicators important in ETH analysis?
The bearish MACD and RSI below 50 indicate the downward momentum is still dominant, helping to project the potential price movement in the short term.
Reference
- NewsBTC. Ethereum Price Retreats from $3450. Accessed December 12, 2025.
Berita Terbaru
© 2026 PT Pintu Kemana Saja. All Rights Reserved.
Kegiatan perdagangan aset crypto dilakukan oleh PT Pintu Kemana Saja, suatu perusahaan Pedagang Aset Keuangan Digital yang berizin dan diawasi oleh Otoritas Jasa Keuangan serta merupakan anggota PT Central Finansial X (CFX) dan PT Kliring Komoditi Indonesia (KKI). Kegiatan perdagangan aset crypto adalah kegiatan berisiko tinggi. PT Pintu Kemana Saja tidak memberikan rekomendasi apa pun mengenai investasi dan/atau produk aset crypto. Pengguna wajib mempelajari secara hati-hati setiap hal yang berkaitan dengan perdagangan aset crypto (termasuk risiko terkait) dan penggunaan aplikasi. Semua keputusan perdagangan aset crypto dan/atau kontrak berjangka atas aset crypto merupakan keputusan mandiri pengguna.