Download Pintu App
Bitcoin Holds Steady at $91,000 — Is EMA Support Signaling a Bullish Trend?
Jakarta, Pintu News – Bitcoin (BTC) price is currently at a decisive point after experiencing a mild decline. Since its peak on January 5, BTC has weakened, but it has not shown any signs of a major decline.
When compared to last year, Bitcoin’s value fell by about 4.5%, reflecting a slightly negative annual performance. While this may seem small, the red numbers mean more than they seem.
Currently, there is little price movement space separating Bitcoin from a rare historical signal that last appeared in 2020. Whether Bitcoin crosses that line or fails to do so could determine the direction of the next trend.
Bitcoin Price Up 0.98% in 24 Hours
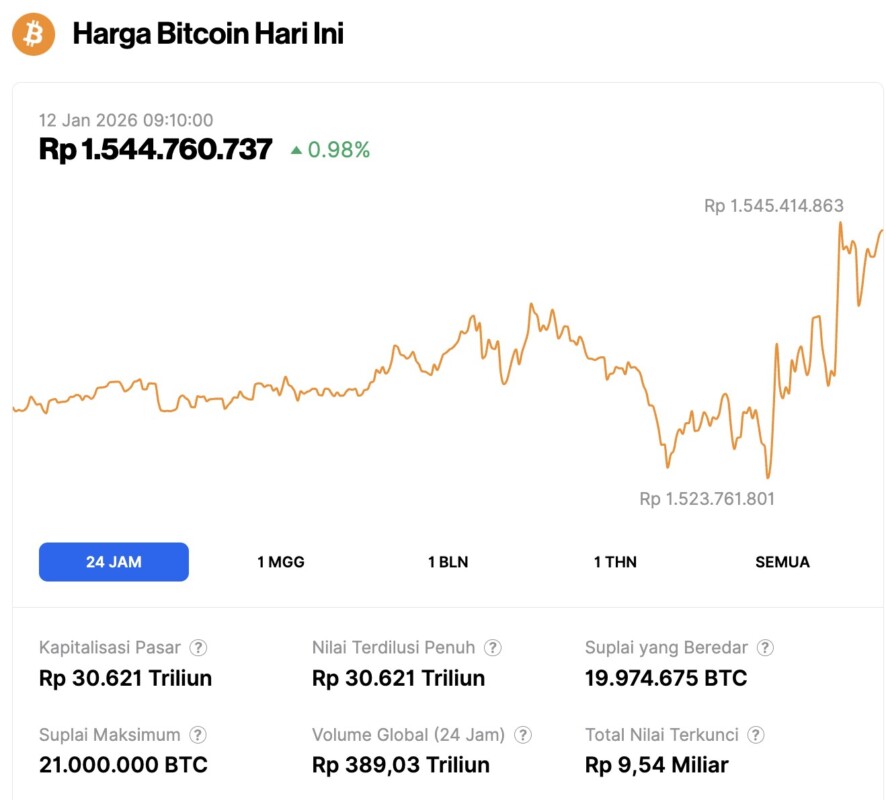
As of January 12, 2026, Bitcoin was trading at $91,405, equivalent to approximately IDR 1,544,760,737 — marking a 0.98% increase over the past 24 hours. During this period, BTC hit a low of IDR 1,523,761,801 and reached a high of IDR 1,545,414,863.
At the time of writing, Bitcoin’s market capitalization is estimated at around IDR 30,621 trillion, while 24-hour trading volume has surged by 69% to IDR 389.03 trillion.
Read also: 5 Crypto Futures Suitable for Scalping During Bear Market
Bitcoin’s 4.5% Price Movement Could Reflect a Rare Pattern in 2020
A recent historical analysis highlights an interesting rare pattern. When Bitcoin’s year-over-year price change goes from negative to positive, it’s often a sign of a major trend shift. The last time this kind of movement appeared was in July 2020 – which was followed by a strong bull market phase.
Currently, Bitcoin is just below that turning point. A rise of about 4.5% from the current price would turn the annual change into a positive one and repeat the historical condition.
The current chart structure supports this importance. Bitcoin is trading within the ” handle” part of a cup and handle pattern, which is a bullish technical formation, where the price pauses after arounded bottom recovery, before attempting to break upwards.
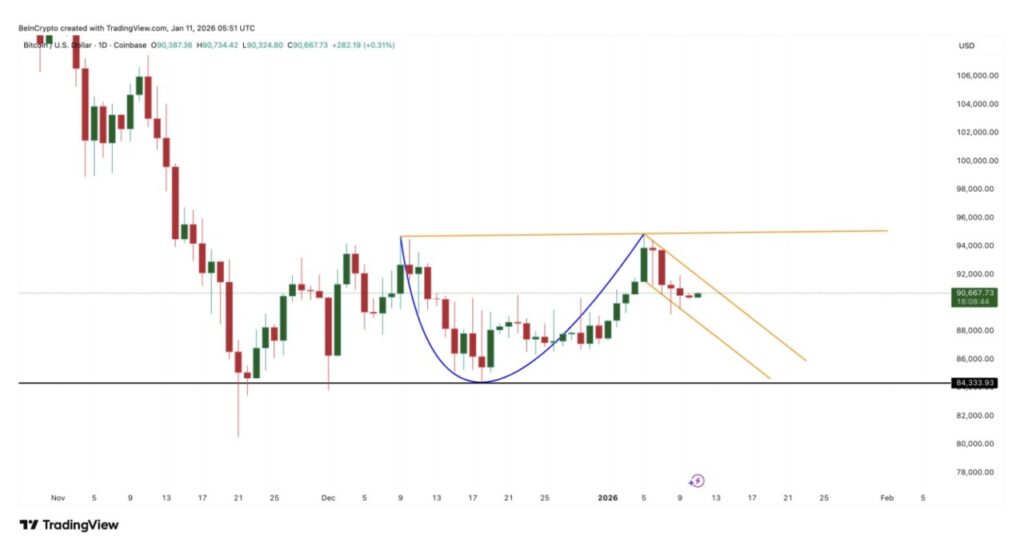
It will be interesting to see if the measured breakout distance of this pattern (above the neckline) will coincide with that 4-5% upside range?
EMA Support and 95% Drop in Selling Pressure Reinforces Bullish Setup
The current short-term trend behavior further strengthens the bullish outlook for Bitcoin.
The exponential moving average (EMA) indicator, which gives more weight to recent price movements, helps monitor the direction of short-term trends. Bitcoin recently managed to reclaim its 20-day EMA and is currently trading above that level. The last time BTC successfully reclaimed the 20-day EMA in early January, the price jumped nearly 7% in just a few days.
Previously, when Bitcoin lost its 20-day EMA in mid-December, the price corrected down by 6.6%, showing how sensitive the price is to this level. For now, staying above the 20-day EMA keeps the upward momentum intact.
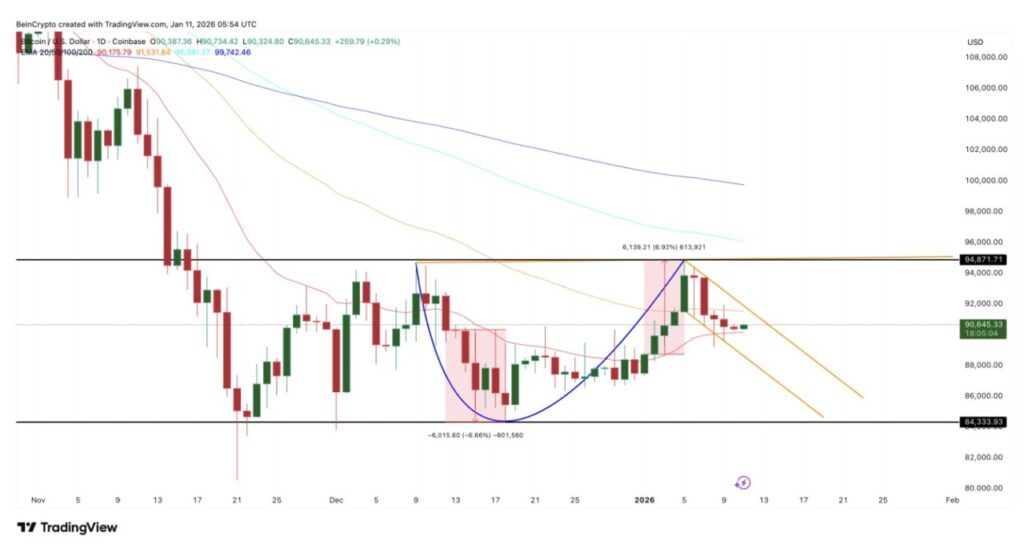
The next hurdle is the 50-day EMA. Bitcoin lost this level on January 12 and corrected soon after. If BTC manages tocleanly reclaim the 50-day EMA, it will signal a stronger trend recovery and support a breakout pattern from the cup and handle formation.
On-chain data also reinforces this argument.Exchange inflow– which tracks the amount of coins sent to exchanges and is often interpreted as a signal of intent to sell – has dropped dramatically to its lowest level in six months. Daily inflow has dropped from around 78,600 BTC on November 21 to around 3,700 BTC currently, a drop of more than 95%.
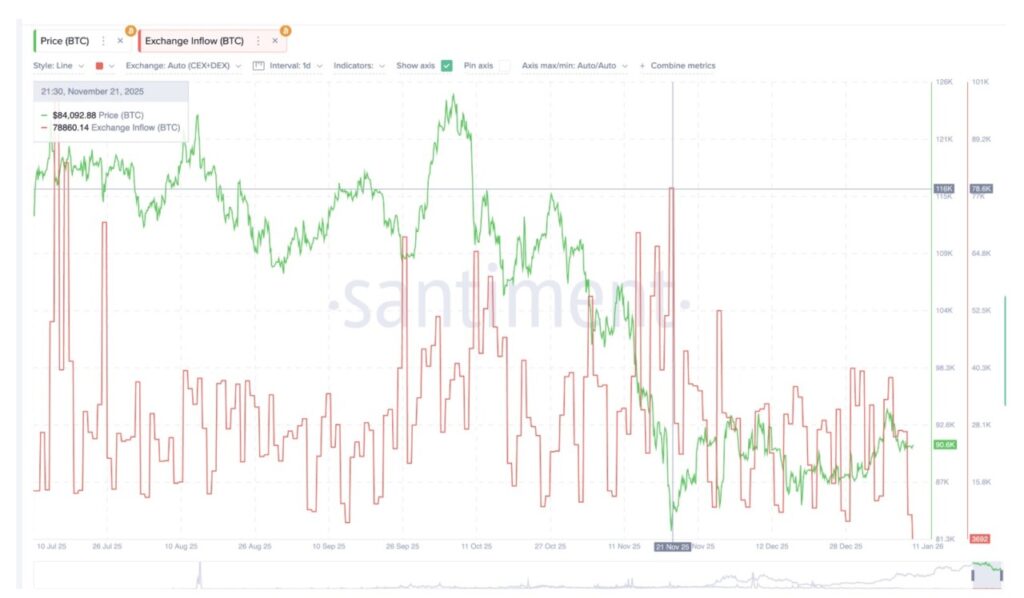
This sharp drop indicates that the selling pressure has subsided. Fewer coins being sent to exchanges means that the supply available for sale when prices rise is also dwindling.
Read also: Crypto that’s Good for the Long-Term in 2026: What to Look Out for?
Derivative Pressure and Bitcoin’s Key Price Levels will Determine the Next Direction
Leveraged positions add an important dimension to the analysis of Bitcoin price movements.
In the next seven days, the total potential liquidation of short positions stands at around $4.10 billion, while the liquidation exposure of long positions is around $2.17 billion. This means that short positions are almost 89% larger than long positions.
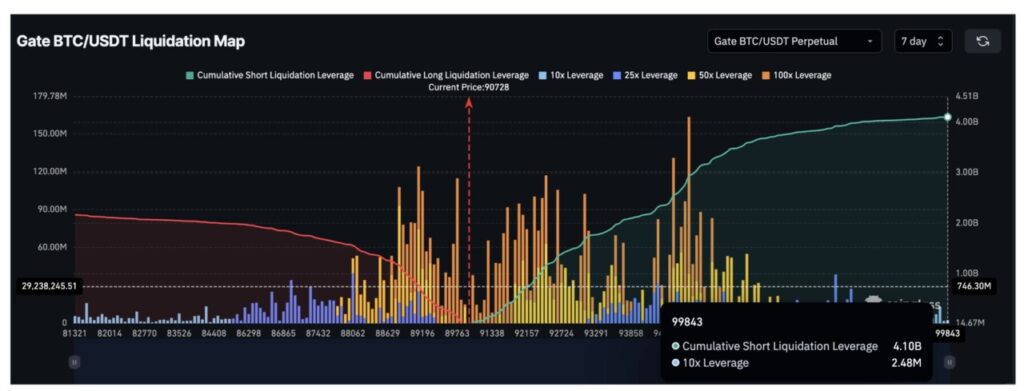
A dense buildup of short positions could be the fuel for a rally. If BTC prices start to rise, short sellers could be forced to cover their positions – creating an automatic buying pressure(short squeeze). Over the past year, Bitcoin has often moved against its leverage bias, making this imbalance more significant than just a bearish signal.
All these factors converge at some crucial price levels.
A daily close above $94,880 would confirm the breakout of the cup and handle pattern, as well as mark a shift in the yearly change to positive by 4.5%. If that is achieved, the next upside target would be around $99,810, then $106,340, based on Fibonacci extensions and projections from the breakout pattern.
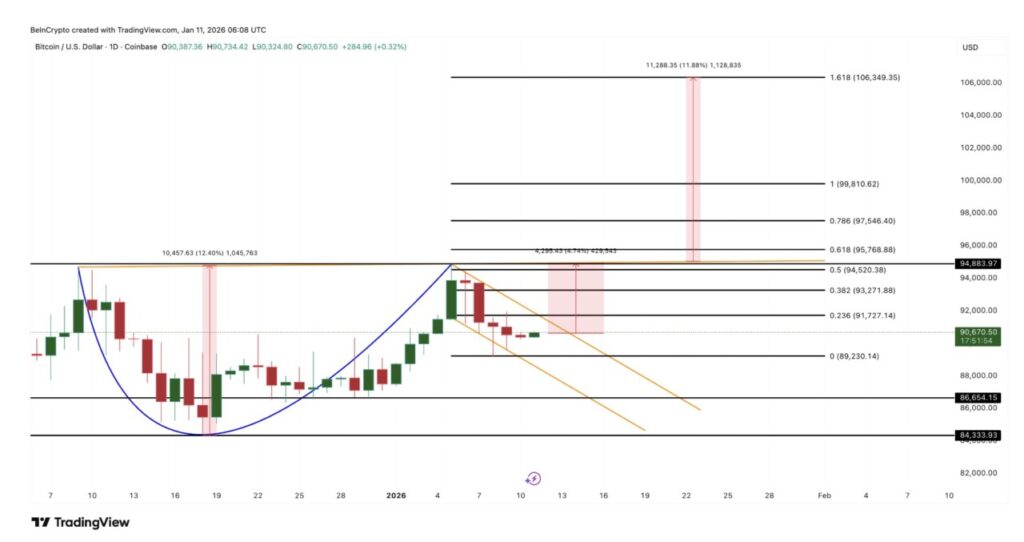
On the downside, $89,230 becomes the first major support level. If this level is broken, the price could fall to around $86,650 and invalidate the existing bullish technical structure.
For now, Bitcoin price is still moving in a narrow corridor.
The selling pressure is at its lowest in six months, the short-term trend is still holding, and the rare historical signal is only 4.5% away. Whether Bitcoin will reach it – that’s what will probably determine the next market direction.
That’s the latest information about crypto. Follow us on Google News to get the latest crypto news about crypto projects and blockchain technology. Also, learn crypto from scratch with complete discussion through Pintu Academy and stay up-to-date with the latest crypto market such as bitcoin price today, xrp coin price today, dogecoin and other crypto asset prices through Pintu Market.
Enjoy an easy and secure crypto trading experience by downloading Pintu crypto app via Google Play Store or App Store now. Also, get a web trading experience with various advanced trading tools such as pro charting, various types of order types, and portfolio tracker only at Pintu Pro.
*Disclaimer
This content aims to enrich readers’ information. Pintu collects this information from various relevant sources and is not influenced by outside parties. Note that an asset’s past performance does not determine its projected future performance. Crypto trading activities have high risk and volatility, always do your own research and use cold cash before investing. All activities of buying and selling bitcoin and other crypto asset investments are the responsibility of the reader.
Reference:
- BeInCrypto. Bitcoin Bull Market Starts With a 4.5% Move? History and Charts Finally Align. Accessed on January 12, 2026
Berita Terbaru
© 2026 PT Pintu Kemana Saja. All Rights Reserved.
Kegiatan perdagangan aset crypto dilakukan oleh PT Pintu Kemana Saja, suatu perusahaan Pedagang Aset Keuangan Digital yang berizin dan diawasi oleh Otoritas Jasa Keuangan serta merupakan anggota PT Central Finansial X (CFX) dan PT Kliring Komoditi Indonesia (KKI). Kegiatan perdagangan aset crypto adalah kegiatan berisiko tinggi. PT Pintu Kemana Saja tidak memberikan rekomendasi apa pun mengenai investasi dan/atau produk aset crypto. Pengguna wajib mempelajari secara hati-hati setiap hal yang berkaitan dengan perdagangan aset crypto (termasuk risiko terkait) dan penggunaan aplikasi. Semua keputusan perdagangan aset crypto dan/atau kontrak berjangka atas aset crypto merupakan keputusan mandiri pengguna.