Download Pintu App
Ethereum Steadies Around $3,100 — With Strong Support From Long-Term Holders
Jakarta, Pintu News – The price of Ethereum (ETH) is on the rise again, recording a gain of more than 2% on Monday (12/1), and still showing positive performance for the month. This rebound looks promising, but the structure behind the price movement is still fragile.
A bearish pattern is still active, and if key levels are not successfully defended, this rise risks turning into a deeper correction. So, how will Ethereum price move today?
Ethereum Price Drops 0.87% in 24 Hours
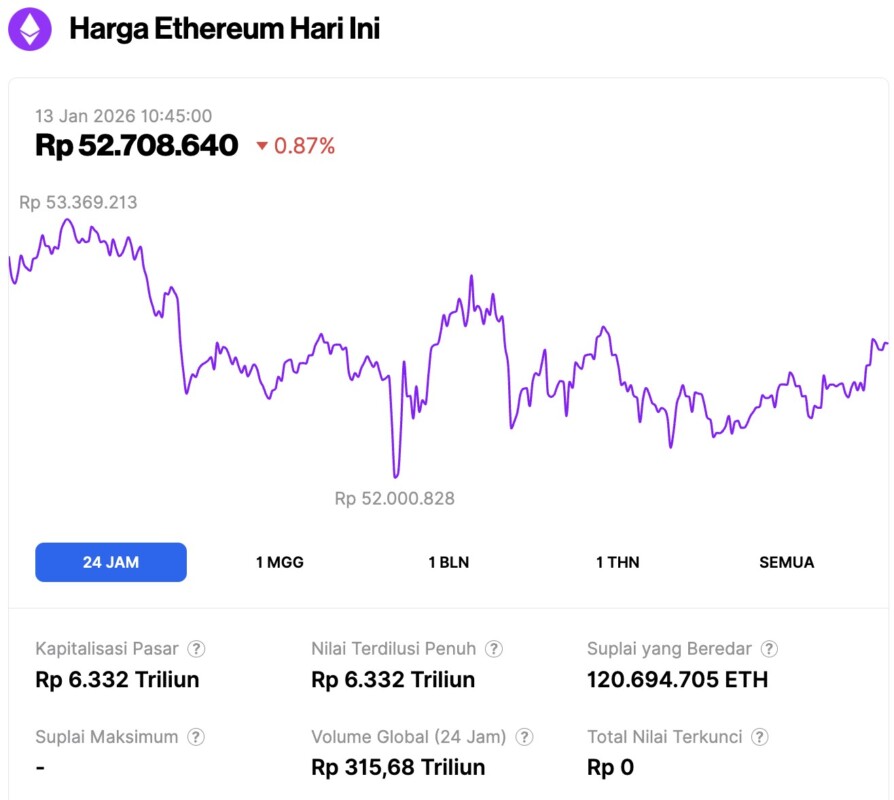
On January 13, 2026, Ethereum was trading at approximately $3,110, or around IDR 52,708,640, after slipping 0.87% in the past 24 hours. During that time, ETH hit a low of IDR 52,000,828 and a high of IDR 53,369,213.
At the time of writing, Ethereum’s market capitalization is estimated at IDR 6,332 trillion, while its daily trading volume has surged 31% in the last 24 hours to reach IDR 315.68 trillion.
Read also: Bitcoin Holds at $91K: A Bullish Run With Storm Clouds on the Horizon?
Ethereum price rises amid fragile bearish structure
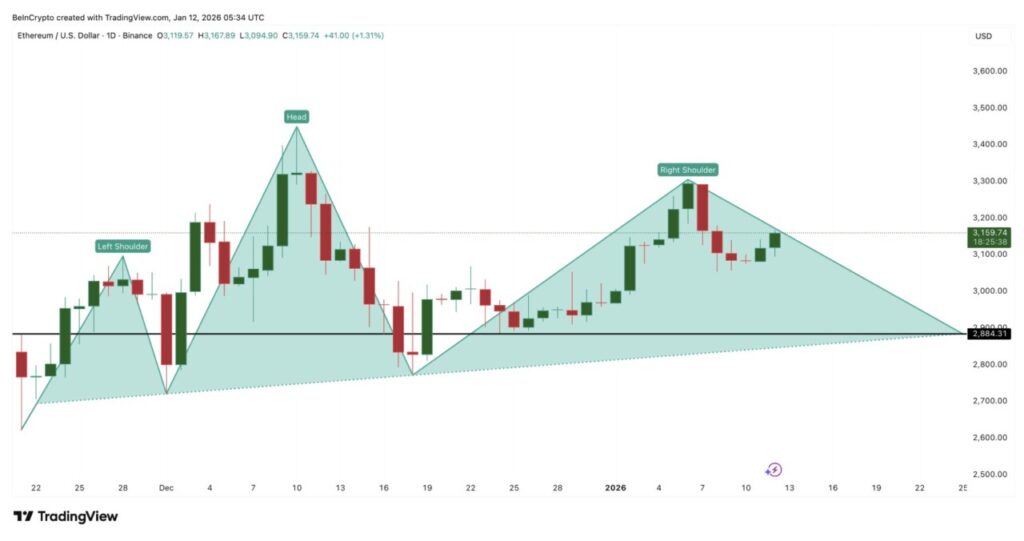
Despite the gains, Ethereum is still trading in a head and shoulders pattern on the daily chart. The price peak on January 6 formed a right shoulder, and currently the price is trying to stabilize without invalidating the pattern.
This is important because head and shoulders patterns generally fail gradually, rather than immediately. Price increases can occur within this pattern, but the situation is only considered safe if the price is able to move decisively away from the neckline risk area, which is around $2,880 for Ethereum.
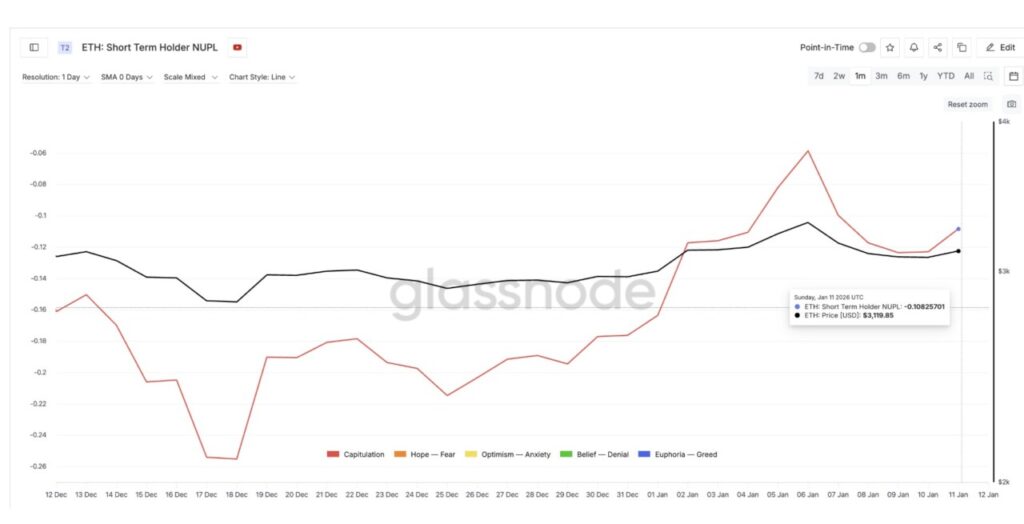
The behavior of short-term holders is also showing signals of caution. The NUPL indicator for short-term holders – which tracks gains or losses on paper – is still in the capitulation zone, although it is starting to approach monthly highs. This could increase the potential for profit-taking if prices continue to rise.
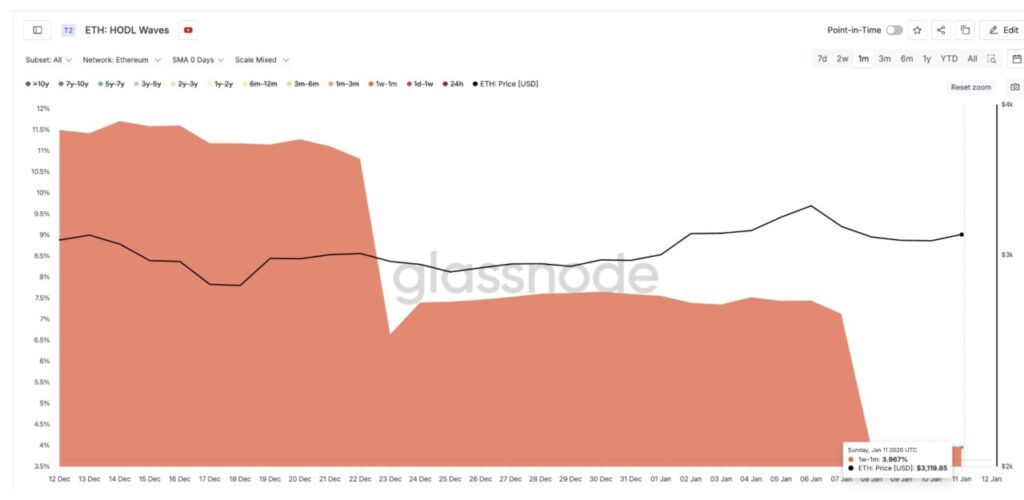
However, the HODL Waves metric, which measures the distribution by duration of ownership, shows that many short-term holders have already exited the market. This means that the risk from NUPL has most likely already occurred.
The group of holders in the 1-week to 1-month time span has dropped dramatically, from around 11.5% of the total supply in mid-December to only around 3.9% currently.
This decline alleviates short-term selling pressure, and also suggests that the current price increase has not been driven by aggressive or speculative new demand.
Although it looks like a lack of interest, it is precisely the lack of short-term buyers that can help ETH prices rise, provided that support from other factors remains.
Buy the Dip and Long-Term Holders Quietly Support ETH
The reason why Ethereum’s price hasn’t experienced a sharp drop comes from the fundamental support behind the price movement.
The Money Flow Index (MFI) indicator – which measures the potential for dip buying – showed a bullish divergence. Between mid-December and early January, the Ethereum price formed lower highs, while the MFI formed higher highs. This indicates that buyers remained active during price weakness, entering the market during corrections instead of exiting their positions.
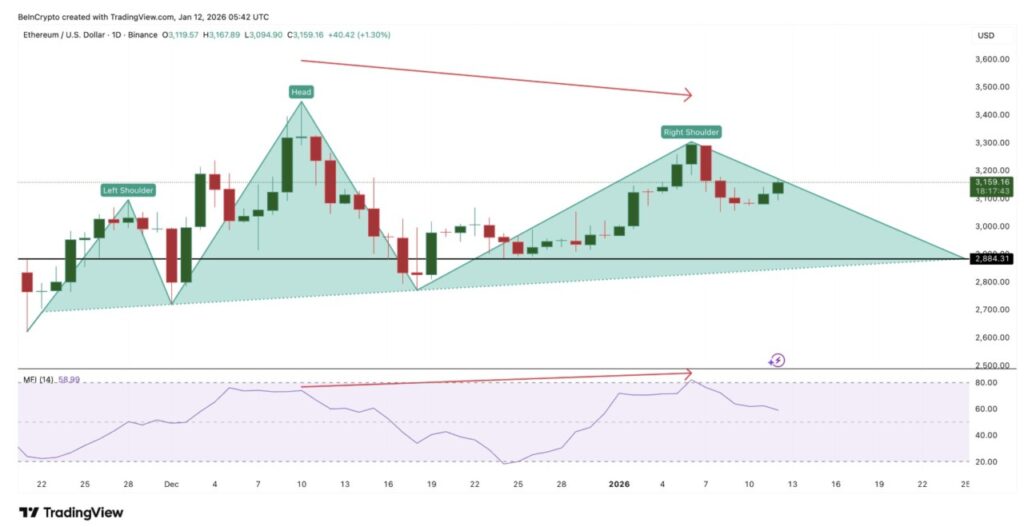
Although the MFI has declined slightly recently, it is still well above the previous low. As long as this condition persists, selling pressure is likely to continue to be absorbed, rather than increase.
Medium- to long-term holders have also joined in this support. The group of Ethereum holders in the 6- to 12-month time span has increased its share of holdings, from around 14.7% to 16.2% since late December. This indicates steady accumulation, not speculative buying chasing momentum.
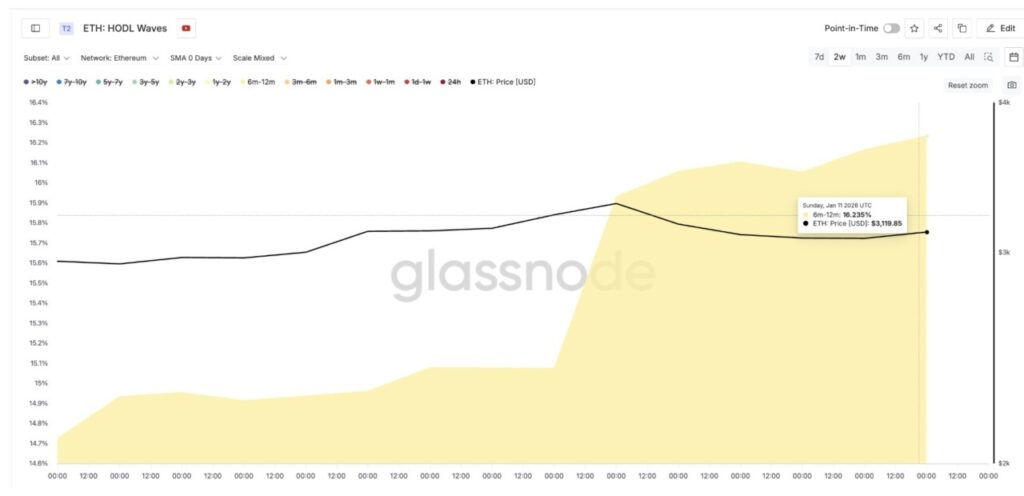
The combination of reduced short-term supply, buying activity as prices fell, and accumulation by medium-to-long-term holders is why Ethereum prices rebounded instead of falling.
Read also: Shiba Inu Rare Signals Reappear: Will SHIB Prices Soar Like in 2021?
However, price support doesn’t mean eliminating risk – it only slows down the downward pressure, not removing it completely.
Ethereum Price Levels that Determine Whether the Rebound will Last
Ethereum is now at a crucial juncture.
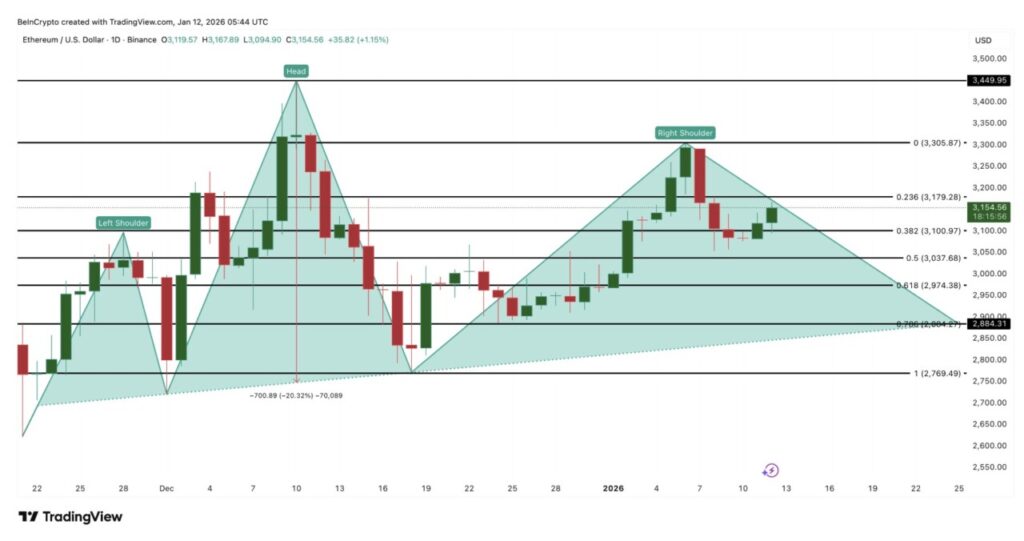
The most important downside level is around $2,880, which is the neckline zone of the head and shoulders pattern. If Ethereum closes the daily candle below this level, then the bearish pattern will be fully active and open up a potential drop of around 20%, based on the size of the move from the “head” to the “neckline”.
Above that level, the first important area is between $3,090 to $3,110, with the average at $3,100 – a level that is also clearly visible on the price chart. This range is crucial because there is a concentration of on-chain acquisition costs, where around 1.44 million ETH last changed hands. Areas like this are usually a point of strong market reaction.
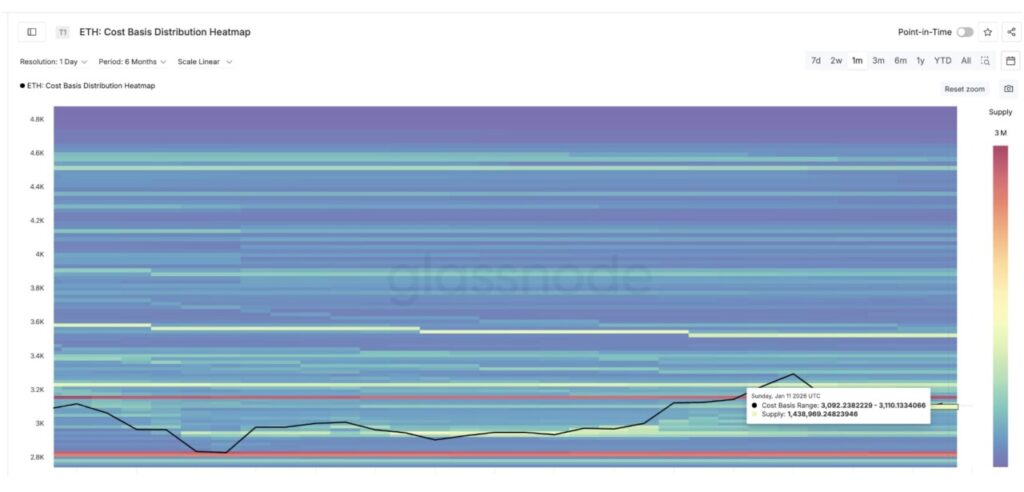
If Ethereum is able to hold above this zone, it strengthens the signal that buyers are holding positions and absorbing selling pressure. However, if it fails to hold, downside pressure could increase to $2,970, and if it continues to weaken, it will retest $2,880 – the most critical support level.
To abort the overall bearish pattern, Ethereum needs to show sustained strength above $3,300. If the price manages to break $3,440, then the risk of the head and shoulders pattern will disappear completely.
That’s the latest information about crypto. Follow us on Google News to get the latest crypto news about crypto projects and blockchain technology. Also, learn crypto from scratch with complete discussion through Pintu Academy and stay up-to-date with the latest crypto market such as bitcoin price today, xrp coin price today, dogecoin and other crypto asset prices through Pintu Market.
Enjoy an easy and secure crypto trading experience by downloading Pintu crypto app through Google Play Store or App Store now. Also, get a web trading experience with various advanced trading tools such as pro charting, various types of order types, and portfolio tracker only at Pintu Pro.
*Disclaimer
This content aims to enrich readers’ information. Pintu collects this information from various relevant sources and is not influenced by outside parties. Note that an asset’s past performance does not determine its projected future performance. Crypto trading activities have high risk and volatility, always do your own research and use cold cash before investing. All activities of buying and selling bitcoin and other crypto asset investments are the responsibility of the reader.
Reference:
- BeInCrypto. Ethereum Bounces – But Is a 20% Trap Forming Beneath One Critical Level? Accessed on January 13, 2026
Berita Terbaru
© 2026 PT Pintu Kemana Saja. All Rights Reserved.
Kegiatan perdagangan aset crypto dilakukan oleh PT Pintu Kemana Saja, suatu perusahaan Pedagang Aset Keuangan Digital yang berizin dan diawasi oleh Otoritas Jasa Keuangan serta merupakan anggota PT Central Finansial X (CFX) dan PT Kliring Komoditi Indonesia (KKI). Kegiatan perdagangan aset crypto adalah kegiatan berisiko tinggi. PT Pintu Kemana Saja tidak memberikan rekomendasi apa pun mengenai investasi dan/atau produk aset crypto. Pengguna wajib mempelajari secara hati-hati setiap hal yang berkaitan dengan perdagangan aset crypto (termasuk risiko terkait) dan penggunaan aplikasi. Semua keputusan perdagangan aset crypto dan/atau kontrak berjangka atas aset crypto merupakan keputusan mandiri pengguna.