Download Pintu App
Ethereum Slips Below Key Levels Near $2,800 — What Comes Next for ETH?
Jakarta, Pintu News – Ethereum fell nearly 1% on Sunday (25/1). This drop itself is actually not that significant. What’s more important is what happened beforehand.
In mid-January, Ethereum (ETH) broke out of a fairly clear inverse head-and-shoulders pattern. At that time, the conditions looked positive – momentum was building, whales were buying, and the price broke out of the key structure. Under normal conditions, this combination usually favors the continuation of the uptrend.
However, the opposite is true. Ethereum got stuck in an important resistance area and has since corrected almost 16%. This wasn’t a random failure. There’s a wall of supply worth around $4 billion that’s quietly absorbing demand, turning the breakout into a classic bull trap.
Ethereum Price Drops 2.93% in 24 Hours
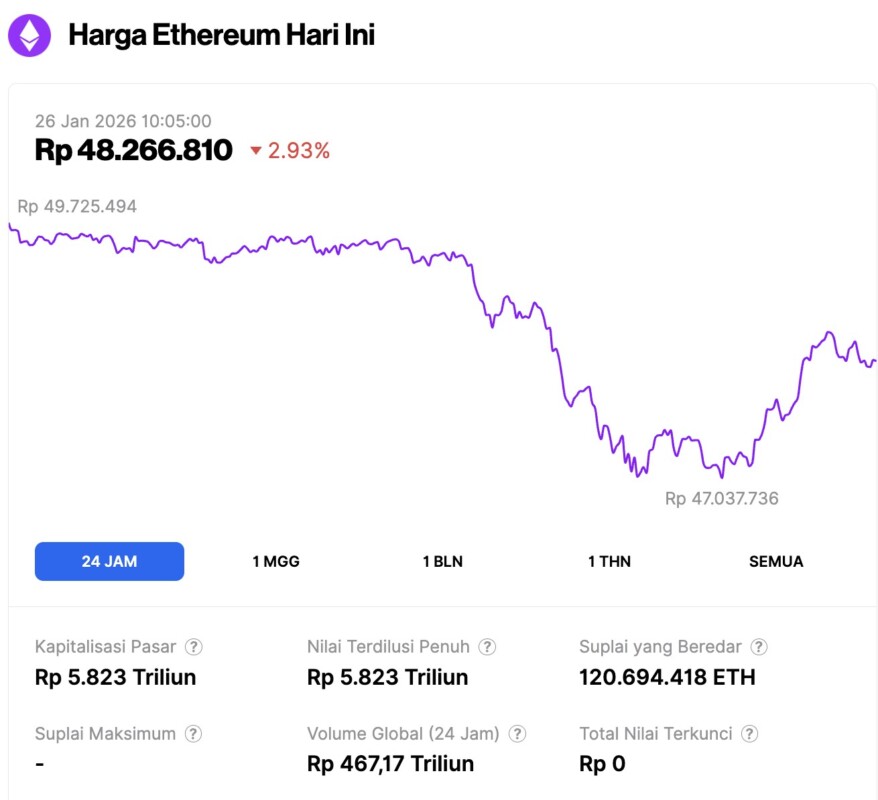
On January 26, 2026, Ethereum was trading at approximately $2,862, or around IDR 48,266,810 — marking a 2.93% drop over the past 24 hours. During that time, ETH hit an intraday low of IDR 47,037,736 and climbed as high as IDR 49,725,494.
At the time of writing, Ethereum’s market capitalization stands at roughly IDR 5,823 trillion, while its 24-hour trading volume surged by 225%, reaching IDR 467.17 trillion.
Read also: 3 Crypto that Potentially Sets New All-Time High at the End of January 2026
The Breakout that Crashed Straight into the $4 Billion Wall
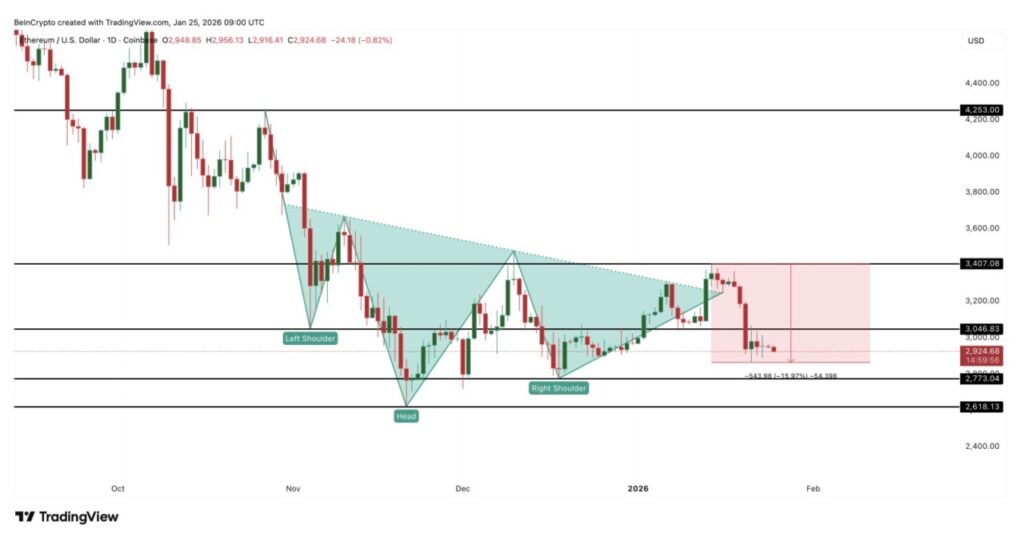
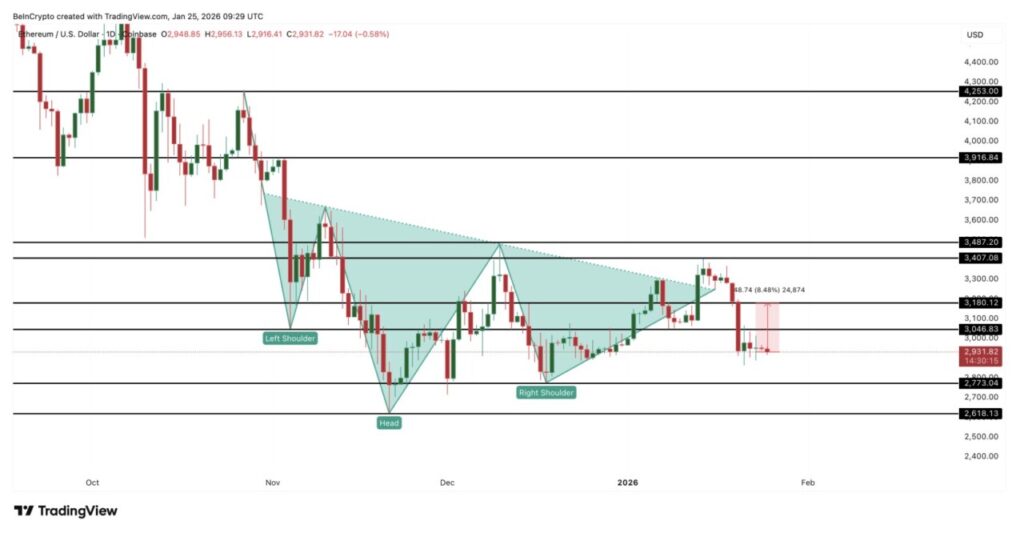
Ethereum’s inverse head-and-shoulders pattern started forming since late October. The breakout was confirmed on January 13, when ETH price broke through the neckline and rose convincingly.
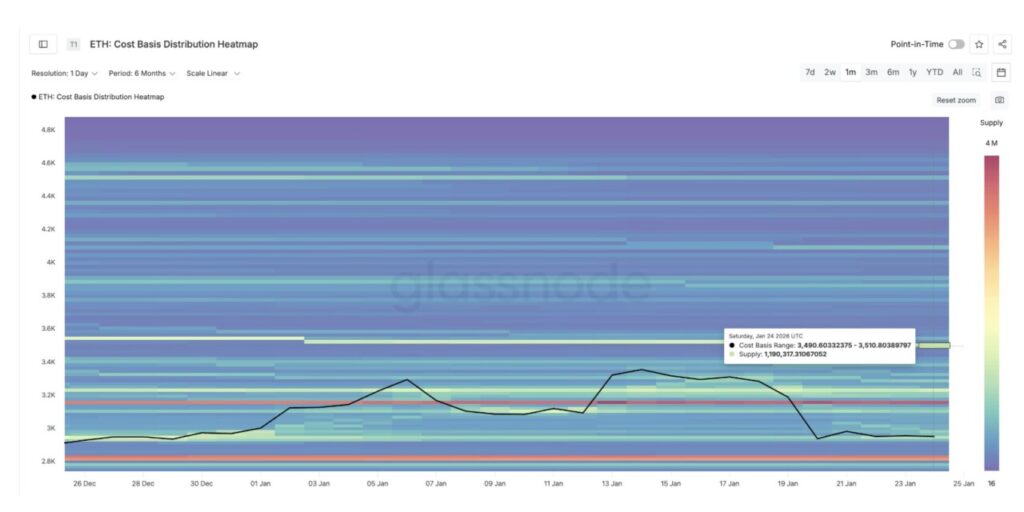
The bull run didn’t fail because the buyers disappeared. The breakout failed because the price hit a solid wall of cost-basis density.
The cost-basis data shows that there is a large concentration of Ethereum holders in the price range of $3,490-$3,510. Approximately 1,190,317 ETH were purchased in this zone. With an average price close to $3,500, the zone represents a supply of about $4.1 billion.
A cost-basis wall is formed when a lot of ETH is bought within a narrow price range. When the price returns to that zone – or close to it – holders usually sell to break even. Early distributions like this create huge selling pressure, despite optimistic market sentiment.
This is what happened around $3,407, where selling pressure thwarted the breakout.
Ethereum briefly approached the wall, got stuck, and then started to weaken. Technically, the breakout was short-lived, but structurally it was broken. The supply pressure is too great – and it’s trapping an important group of investors inside.
Whale Buys on Breakout – But Gets Trapped Instead
What makes this situation even riskier is that the ETH whales have actually taken the “right” step.
Since January 15 (after the breakout was confirmed), large holders have been consistently adding to holdings. The whale balance rose from about 103.11 million ETH to 104.15 million ETH – an addition of about 1.04 million ETH or nearly $3 billion.
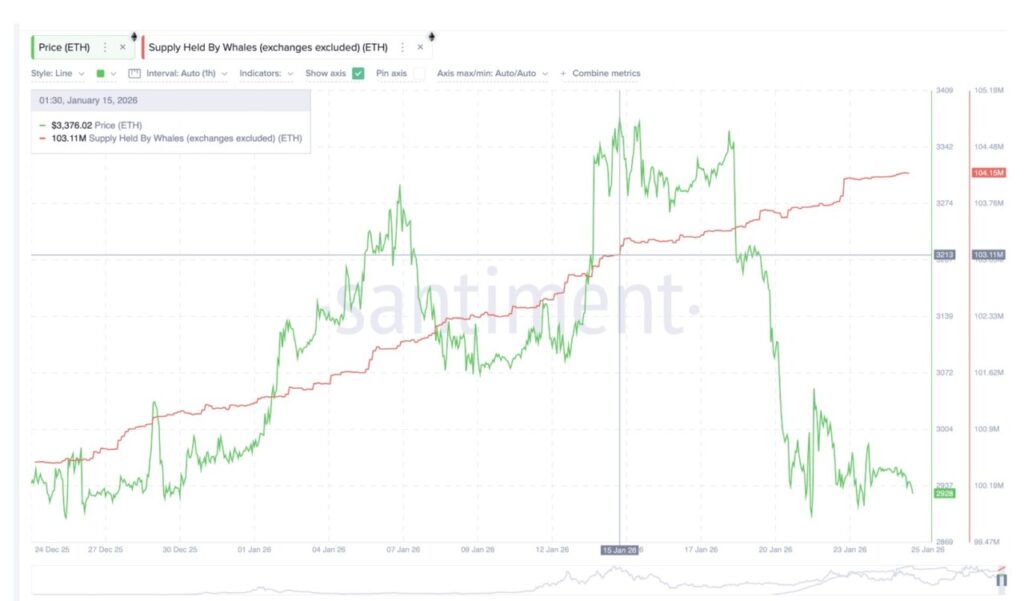
This buying continues even when the price starts to weaken, indicating a pattern of gradual buying (averaging).
Separately, accumulation by whales is usually a positive signal. This time, however, it was not enough.
Read also: 3 Altcoins with Interesting Prospects at the End of January 2026
The problem lies beyond on-chain activities. Fund flows from ETFs are changing dramatically. The week ending January 16 saw strong inflows, which helped fuel the breakout. But the following week, which ended on January 23, saw ETF outflows of $611.17 million.
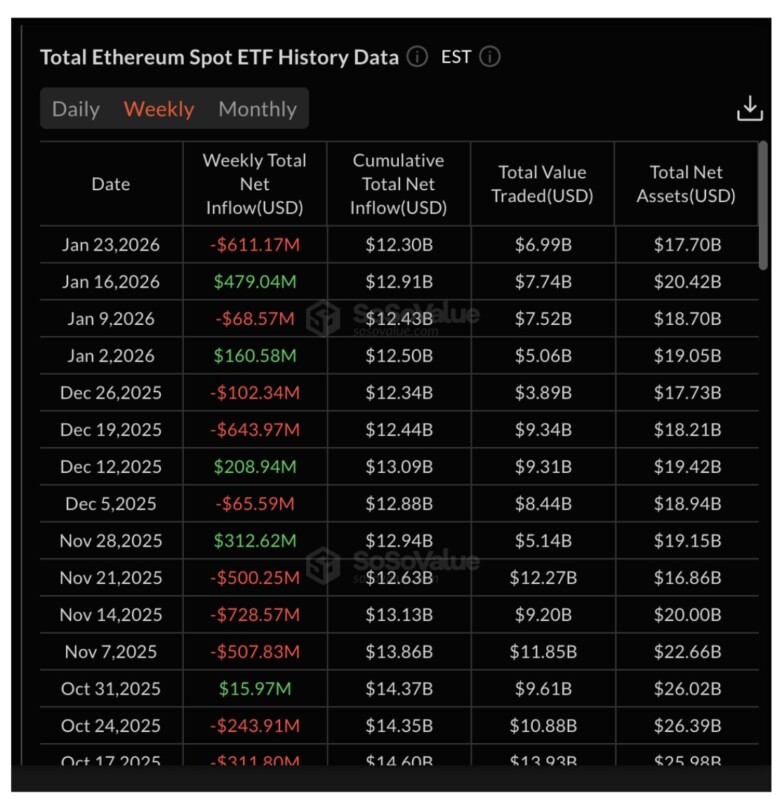
This change has been very influential. Selling from ETFs added to the consistent selling pressure, just when Ethereum was testing a huge supply wall. Whale buying was stifled. Even large holders ended up getting stuck above support levels as Ethereum’s price continued to decline.
This is the reason why the correction continues despite accumulation. Demand is there – especially from the whales – but supply is far more dominant. The wall is winning. When negative ETF flows and cost-basis resistance come together, the price structure can collapse quickly.
Ethereum Price Levels that Determine the Next Direction
Currently, Ethereum has re-entered the previous price range, and its structure appears fragile. On the downside, the $2,773 level is a crucial point, as seen on the Ethereum price chart.
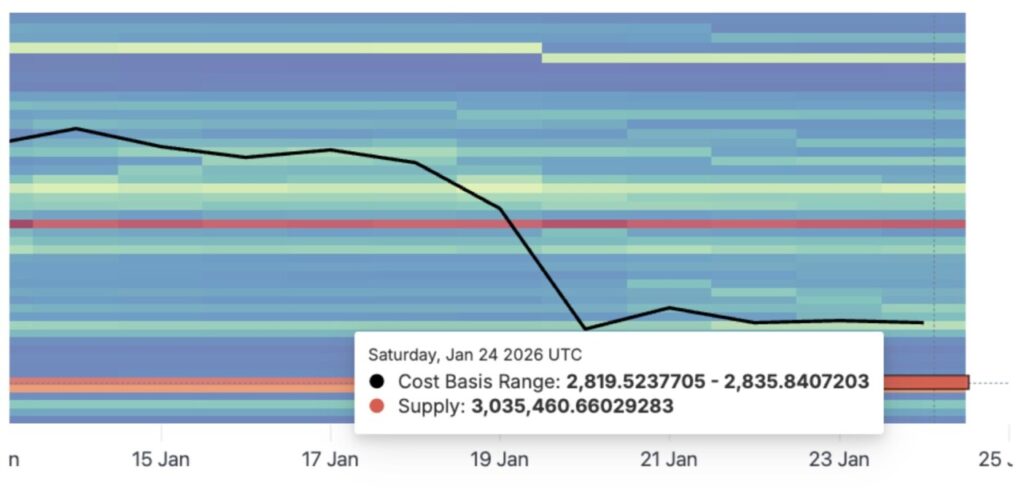
In the event of a daily close below this zone, the inverse head-and-shoulders pattern will be completely broken, confirming that the previous breakout was just a bull trap. This move will also threaten the cost-basis zone between $2,819 to $2,835.
While this is a high-demand zone that could absorb selling pressure, if it fails to hold, Ethereum is at risk of a more rapid decline.
Below that level, the price structure will weaken rapidly. While on the upside, recovery should be gradual.
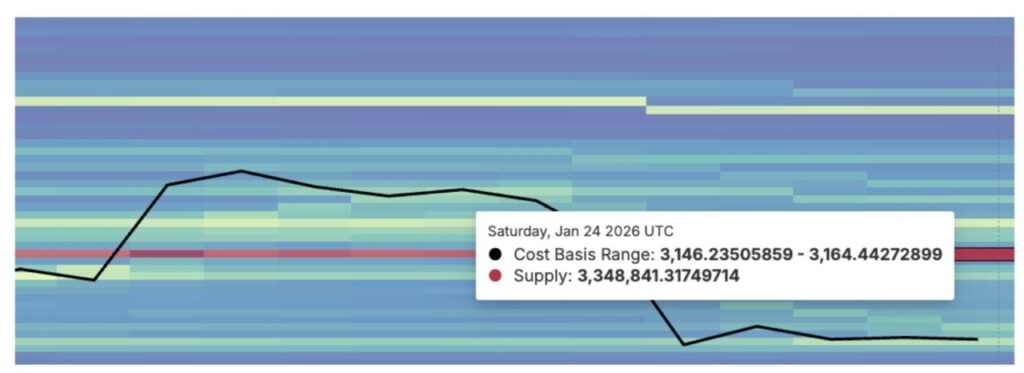
First, Ethereum needs to reclaim the $3,046 level. This will help stabilize the price, but not enough. The real test will be at $3,180, which serves as the key to breaking the supply wall in the $3,146 to $3,164 range. Breaking through this zone will signal the return of real demand.
However, resistance is still very strong. A larger sell wall in the range of $3,407-$3,487 still dominates the chart. This is the zone that previously thwarted the breakout and triggered the correction.
As long as Ethereum hasn’t actually broken through those levels, any price rally remains at risk of reversal. The conclusion is simple: Ethereum’s failure is not due to a lack of buyers, but due to enormous supply pressure. Until this changes, the bull trap remains active.
Follow us on Google News to stay up to date with the latest in crypto and blockchain technology. Check Bitcoin price, usdt to idr and tokenized nvidia stock price through Pintu Market.
Enjoy an easy and secure crypto trading experience by downloading the Pintu crypto app via Play Store or App Store now. Also, experience web trading with advanced trading tools such as pro charting, various order types, and portfolio tracker only at Pintu Pro.
*Disclaimer
This content aims to enrich readers’ information. Pintu collects this information from various relevant sources and is not influenced by outside parties. Note that an asset’s past performance does not determine its projected future performance. Crypto trading activities are subject to high risk and volatility, always do your own research and use cold hard cash before investing. All activities of buying and selling Bitcoin and other crypto asset investments are the responsibility of the reader.
Reference:
- BeInCrypto. Ethereum Whales Fell Into a $4 Billion Bull Trap: What’s Next for ETH Price? Accessed on January 26, 2026
Berita Terbaru
© 2026 PT Pintu Kemana Saja. All Rights Reserved.
Kegiatan perdagangan aset crypto dilakukan oleh PT Pintu Kemana Saja, suatu perusahaan Pedagang Aset Keuangan Digital yang berizin dan diawasi oleh Otoritas Jasa Keuangan serta merupakan anggota PT Central Finansial X (CFX) dan PT Kliring Komoditi Indonesia (KKI). Kegiatan perdagangan aset crypto adalah kegiatan berisiko tinggi. PT Pintu Kemana Saja tidak memberikan rekomendasi apa pun mengenai investasi dan/atau produk aset crypto. Pengguna wajib mempelajari secara hati-hati setiap hal yang berkaitan dengan perdagangan aset crypto (termasuk risiko terkait) dan penggunaan aplikasi. Semua keputusan perdagangan aset crypto dan/atau kontrak berjangka atas aset crypto merupakan keputusan mandiri pengguna.