Download Pintu App
Shiba Inu Price Prediction: SHIB Struggles Under Bearish Trend Despite 1,200% Surge in Burn Rate
Jakarta, Pintu News – Shiba Inu (SHIB) is still under pressure in trading, as seen from the 4-hour chart which shows a price movement pattern that tends to be bearish to neutral. Price action remains stuck below the major moving averages, indicating that the dominance of sellers is still strong.
As a result, traders’ attention is now on SHIB’s ability to hold the short-term support level or risk a deeper drop.
Price Structure Shows Limited Increase
SHIB is trading below its 20, 50, 100, and 200 period EMAs on the 4-hour chart. This arrangement reflects continued downward pressure. Whenever the price tries to rebound, it is always stuck in the area of this set of EMAs, which further confirms the sellers’ dominance. Signals from the Parabolic SAR also favor the downward direction, as SAR dots keep appearing above the price.
Read also: Aster Crypto Stage 4 Airdrop: Early Claims Opened, 754,041 ASTER Wiped Out!
Immediate support is around $0.00000760, which is now an important pivot point. Previously, buyers had defended this level during a small rebound. If this level fails to hold, the price could be pressured to the demand zone between $0.00000750 to $0.00000745.
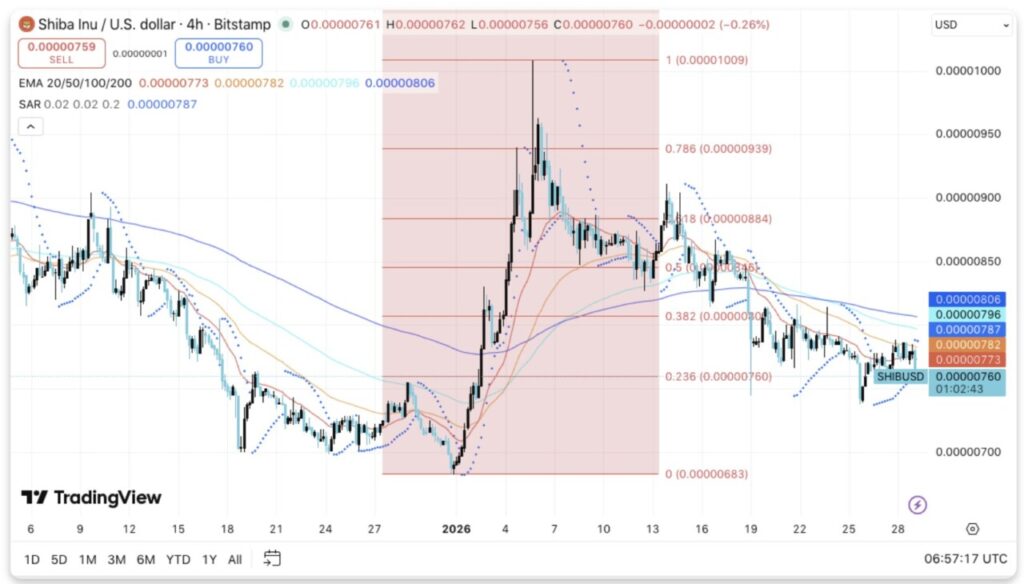
In case of a decisive breakout, the price movement could continue towards $0.00000730. Analysts also mark $0.00000683 as a key swing low level, where buyers are likely to mount a stronger defense.
On the upside, initial resistance appears in the range of $0.00000773 to $0.00000782, an area where EMA pressure is concentrated. In addition, $0.00000796 is an area of previous consolidation. For a sustained recovery, the price needs to break and hold above $0.00000826, which is the 0.5 Fibonacci level.
Furthermore, $0.00000884 is an important barrier, as a trend reversal requires a strong price close above that zone.
Derivative and Spot Data Show Cautious Attitude
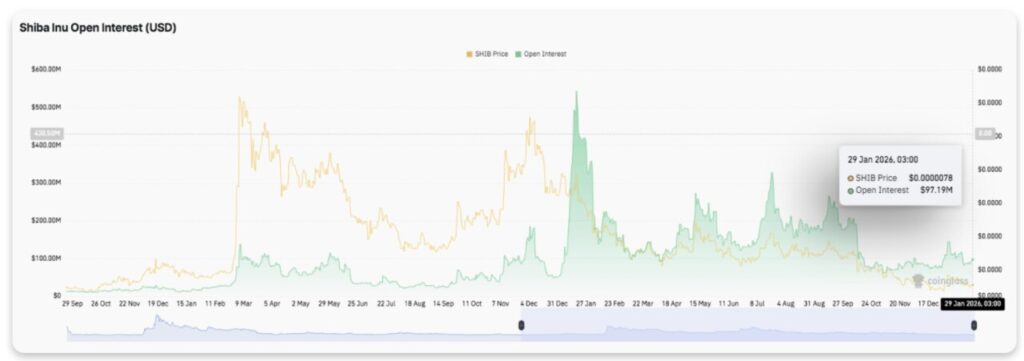
The open interest trend shows a recurring pattern of expansion and contraction. The initial accumulation phase is usually followed by a sharp spike in prices driven by the use of leverage. However, after reaching its peak, market interest tends to decline, indicating a reduced risk appetite.
Recently, open interest stabilized at a lower level compared to the previous extreme. The recent increase to $97 million suggests renewed speculation, although the increase in leverage has been gradual and not aggressive.
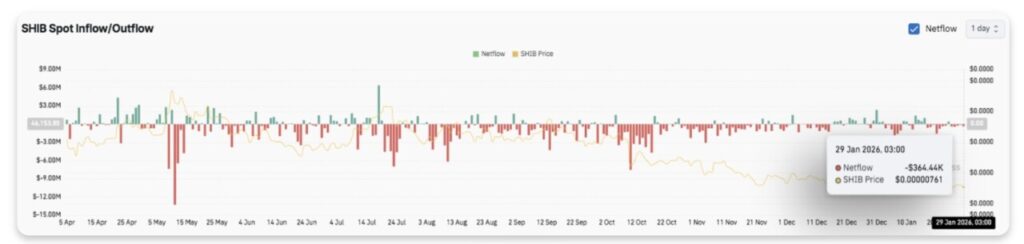
Meanwhile, fund flows in the spot market remained bearish. Net outflows dominated most of the period, reflecting continued distribution action. Several previous spikes in outflows coincided with large sell-offs in recent months.
In addition, inflows tend to be shallow and temporary. Since October, selling pressure has been controlled, rather than panic-induced. However, the net outflows that continued until the end of January signaled that the demand recovery was still weak.
Burn Activity Adds to Deflationary Aspects
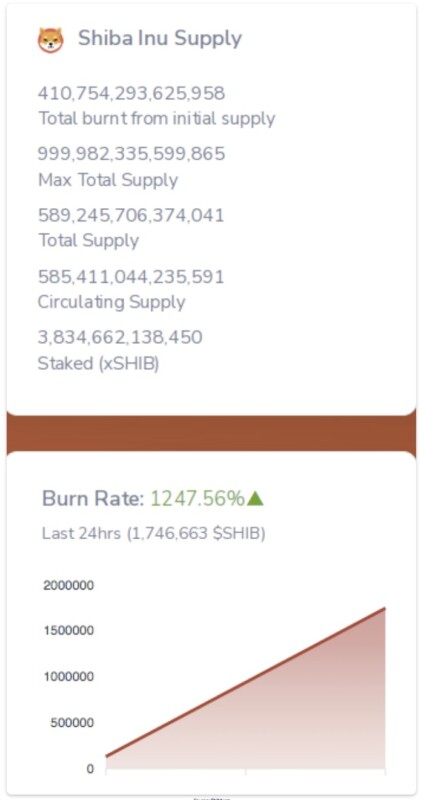
Token supply data shows a continued reduction due to the active burn process. To date, a total of 410.75 trillion SHIB has been permanently destroyed. The total supply currently stands at around 589.25 trillion SHIB, while the circulating supply is still high at around 585.41 trillion SHIB.
Read also: Dogecoin Price Crashes 6% Today: What Happened?
In addition, around 3.83 trillion SHIBs are being staked in the form of xSHIBs, thereby reducing direct liquidity in the market.
Burn activity surged sharply in the past 24 hours. The burn rate increased by more than 1,200%, with approximately 1.75 million SHIB being destroyed. Although the burn process supports long-term scarcity, the direction of prices remains highly dependent on the strength of demand.
Hence, SHIB is still vulnerable to correction unless buyers are able to convincingly reclaim the key resistance level.
Technical Outlook for Shiba Inu Prices Ahead of February
Key levels are now forming quite tightly as the Shiba Inu moves from late January into February. Price action is showing a compression pattern after a long decline.
SHIB is still trading below its major moving averages, signaling a cautious short-term momentum. However, the narrowing price range hints at the potential for increased volatility as we enter February.
Upside Level:
The nearest resistance is at $0.00000782, followed by $0.00000796. If price manages to cleanly break both of these zones, the recovery could continue to $0.00000826. Above that, $0.00000884 remains an important resistance level that needs to be reversed to confirm a broader trend change.
Downside Levels:
On the downside, $0.00000760 becomes an important short-term pivot point. Holding this level keeps the price structure stable. In the event of a break below $0.00000750, the price could weaken to $0.00000730, with $0.00000683 being the main downside target and cyclical support.
Major Resistance Boundary:
The $0.00000826 region, which aligns with the 0.5 Fibonacci retracement, is a key level that the bulls need to reclaim to restore medium-term momentum. Meanwhile, price acceptance above $0.00000884 would be a strong signal of a significant change in trend structure.
Technically, SHIB currently appears to be consolidating in a bearish pattern that reflects a balance between cautious buyers and pushy sellers. This structure is often the precursor to increased volatility, especially when liquidity starts to return after the January market position adjustment.
Will Shiba Inu Determine Direction in February?
The outlook for SHIB in February will largely depend on the buyers’ ability to defend the $0.00000760 base level while pushing momentum to the $0.00000782-$0.00000826 resistance area.
The stabilization of open interest and controlled spot outflows suggest that selling pressure is no longer too aggressive. Hence, if there is an increase in inflows, short-term recovery opportunities could open up.
However, if the price fails to hold above $0.00000750, the technical structure will weaken and market attention will shift to deeper support. For now, SHIB is in a crucial zone. Consolidation throughout January has been the foundation, but volume and market conviction in February will most likely determine the next direction.
Follow us on Google News to stay up to date with the latest in crypto and blockchain technology. Check Bitcoin price, usdt to idr and tokenized nvidia stock price through Pintu Market.
Enjoy an easy and secure crypto trading experience by downloading the Pintu crypto app via Play Store or App Store now. Also, experience web trading with advanced trading tools such as pro charting, various types of order types, and portfolio tracker only at Pintu Pro.
*Disclaimer
This content aims to enrich readers’ information. Pintu collects this information from various relevant sources and is not influenced by outside parties. Note that an asset’s past performance does not determine its projected future performance. Crypto trading activities are subject to high risk and volatility, always do your own research and use cold hard cash before investing. All activities of buying and selling Bitcoin and other crypto asset investments are the responsibility of the reader.
Reference:
- CoinEdition. Shiba Inu Price Prediction: SHIB Faces Bearish Pressure Despite 1,200% Burn Rate Spike. Accessed on January 30, 2026
Berita Terbaru
© 2026 PT Pintu Kemana Saja. All Rights Reserved.
Kegiatan perdagangan aset crypto dilakukan oleh PT Pintu Kemana Saja, suatu perusahaan Pedagang Aset Keuangan Digital yang berizin dan diawasi oleh Otoritas Jasa Keuangan serta merupakan anggota PT Central Finansial X (CFX) dan PT Kliring Komoditi Indonesia (KKI). Kegiatan perdagangan aset crypto adalah kegiatan berisiko tinggi. PT Pintu Kemana Saja tidak memberikan rekomendasi apa pun mengenai investasi dan/atau produk aset crypto. Pengguna wajib mempelajari secara hati-hati setiap hal yang berkaitan dengan perdagangan aset crypto (termasuk risiko terkait) dan penggunaan aplikasi. Semua keputusan perdagangan aset crypto dan/atau kontrak berjangka atas aset crypto merupakan keputusan mandiri pengguna.