Download Pintu App
5 Critical Signals: BONK Plummets 18% as Memecoin Weakens, Short Bounce or Down Again?
Jakarta, Pintu News – The crypto and cryptocurrency market faced pressure again in the past week, with the memecoin sector recording a deep collective correction. Market data shows that memecoin fell by around 15.47%, while Bonk (BONK) corrected more sharply by 18.77%. This weakness raises an important question for young and novice investors as to whether BONK’s decline presents an opportunity for a short-term bounce or the start of a further downward phase.
Market Pressure Makes BONK’s Price Structure Fragile
BONK’s decline comes as the general crypto market sentiment weakens. In recent days, selling pressure has been more dominant than price recovery efforts. As a result, some support levels that were previously holding are starting to be broken with relative ease.
These conditions shifted BONK’s price structure back to a medium to long-term downtrend. Although BONK is still ranked as the sixth largest memecoin by market capitalization, this position is not enough to protect against liquidity outflows. When theecoin sector weakens simultaneously, assets with high volatility usually experience the deepest correction.
Also Read: 7 Ethereum (ETH) 2026 Price Predictions: Bullish Targets, Risks & Projections
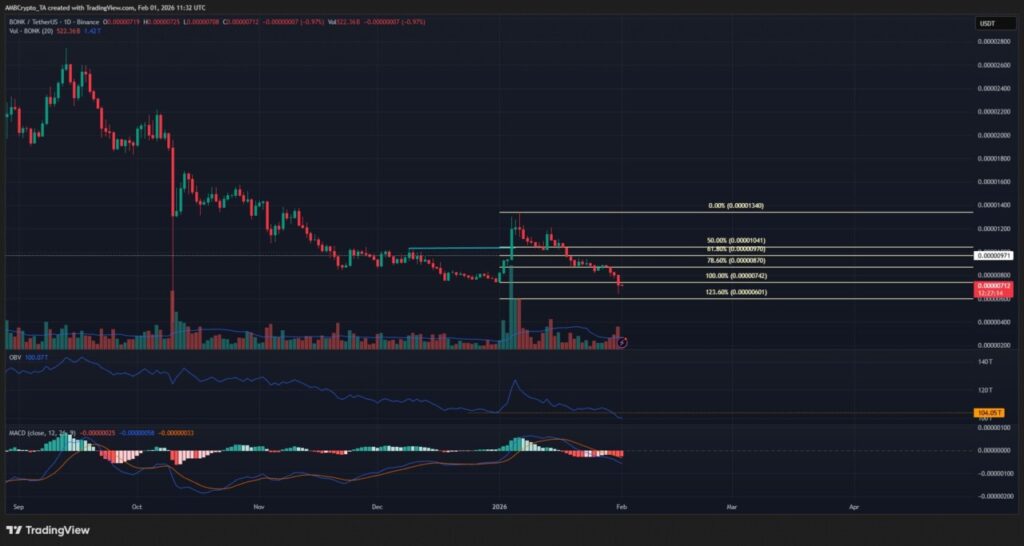
Early January Bullish Signal Fails to Survive
In early January, BONK briefly gave hope through a bullish structural shift. The price managed to break the downtrend swing point at around USD 0.0000103 or around Rp0.17. This movement prompted a further rally up to USD 0.0000134 or around IDR 0.22.
However, the rally was short-lived and failed to form the foundation of a new trend. Throughout the rest of the month, prices weakened again and erased most of the gains. The failure to hold these highs indicated that the buying impulse was not strong enough to change the direction of the main trend.
Volume Indicator Still Shows Distribution
In terms of indicators, the On-Balance Volume (OBV) gave a negative signal. The OBV fell through the December low, signaling continued distribution or selling pressure. The downtrend in OBV that has been ongoing since August has been maintained until now.
This makes the early January rally look more like a temporary spike than a solid trend reversal. In technical analysis, negative divergence in volume is often a warning that price recovery is not supported by sufficient market participation. This reinforces the view that BONK’s structure is still in a bearish phase.
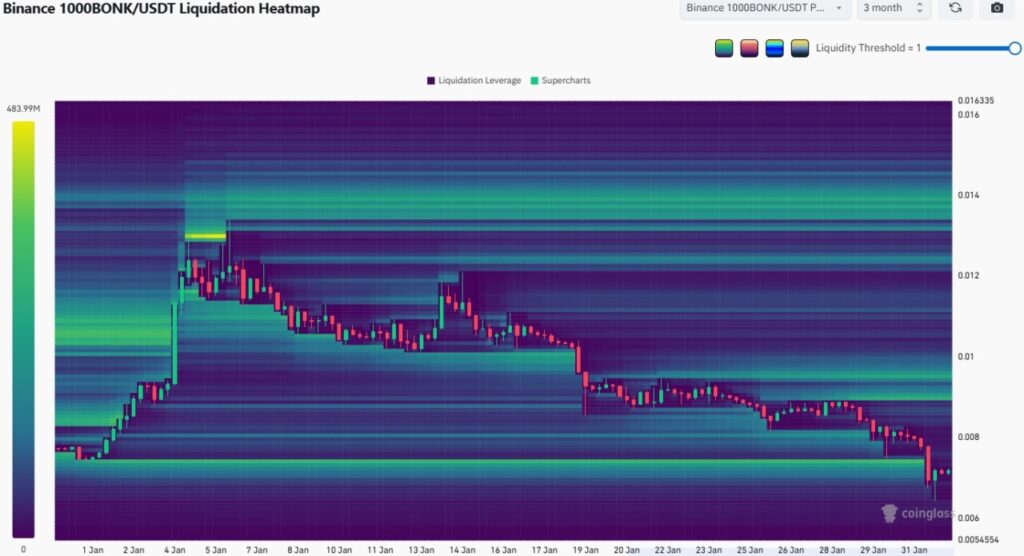
The Impact of Bitcoin and the Liquidity Map
The pressure on BONK is also inseparable from the movement of Bitcoin (BTC) as the main asset of the crypto market. In the last two weeks, BTC has struggled to stay above USD 94,500 or around Rp1.59 billion. This inability is often read as weakening investor risk appetite.
When Bitcoin weakens, high-risk altcoins such as memecoins tend to experience sharper declines. From the liquidation map, the area around USD 0.0000074 or about Rp0.12 on BONK has been swept away. After that, there are pockets of liquidity above the price, especially in the range of USD 0.0000090-0.0000095 or around Rp0.15-Rp0.16, which has the potential to pull up the price in the very short term.
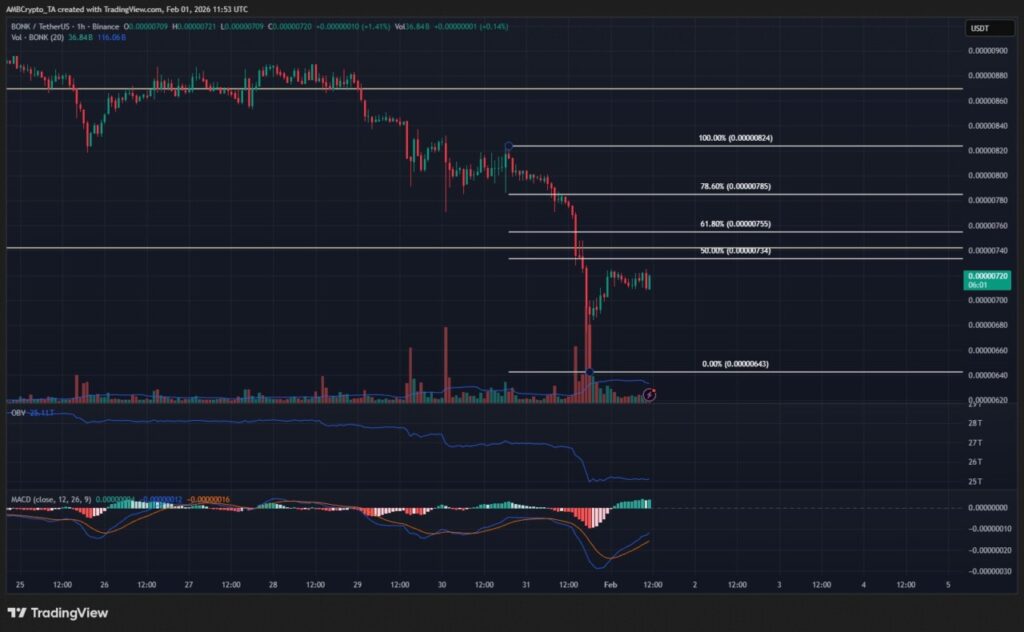
Short-Term Bounce Scenario Still Limited
On the lower time frame, BONK’s price structure is forming a bearish scenario with a potential technical bounce. The area of USD 0.00000755 to USD 0.00000785 or around IDR 0.13 is mapped as an important Fibonacci retracement zone. This zone has the potential to become resistance in the event of a bounce.
If the price fails to break out of this area, the risk of further downside remains open. The next downside target is expected to be USD 0.0000064 or around IDR 0.11, with the possibility of extending to USD 0.0000060 to USD 0.0000053. This structure suggests that room for correction is still available if the selling pressure does not subside.
Conclusion
Overall, BONK’s 18.77% decline was in line with the weakness in the memecoin sector which fell 15.47% on the week. The brief rally in early January is now seen as a minor disruption amidst a longer downtrend, especially as volume indicators remain weak. Although the liquidity map opens up opportunities for a short-term bounce, the current technical structure is still bearishly skewed. This information is educational in nature and not investment advice, so independent analysis is still required before making decisions in the crypto and cryptocurrency markets.
Also Read: 7 Gold Price Predictions for February 2026: Rise, Scenarios & Risk Factors!
Follow us on Google News to stay up to date with the latest crypto and blockchain technology. Check Bitcoin price, USDT to IDR and Nvidia stock price tokenized via Pintu Market.
Enjoy an easy and secure crypto trading experience by downloading the Pintu crypto app via Play Store or App Store now. Also, experience web trading with advanced trading tools such as pro charting, various order types, and portfolio tracker only at Pintu Pro.
*Disclaimer
This content aims to enrich readers’ information. Pintu collects this information from various relevant sources and is not influenced by outside parties. Note that an asset’s past performance does not determine its projected future performance. Crypto trading activities are subject to high risk and volatility, always do your own research and use cold hard cash before investing. All activities of buying and selling Bitcoin and other crypto asset investments are the responsibility of the reader.
Reference
- AMBCrypto. BONK drops 18% as memecoins slide – Is another leg down coming? Accessed February 2, 2026.
Berita Terbaru
© 2026 PT Pintu Kemana Saja. All Rights Reserved.
Kegiatan perdagangan aset crypto dilakukan oleh PT Pintu Kemana Saja, suatu perusahaan Pedagang Aset Keuangan Digital yang berizin dan diawasi oleh Otoritas Jasa Keuangan serta merupakan anggota PT Central Finansial X (CFX) dan PT Kliring Komoditi Indonesia (KKI). Kegiatan perdagangan aset crypto adalah kegiatan berisiko tinggi. PT Pintu Kemana Saja tidak memberikan rekomendasi apa pun mengenai investasi dan/atau produk aset crypto. Pengguna wajib mempelajari secara hati-hati setiap hal yang berkaitan dengan perdagangan aset crypto (termasuk risiko terkait) dan penggunaan aplikasi. Semua keputusan perdagangan aset crypto dan/atau kontrak berjangka atas aset crypto merupakan keputusan mandiri pengguna.