Download Pintu App
Bitcoin Plunges to $72,000 as Analysts Point to Patterns from Previous Bull Runs
Jakarta, Pintu News – Bitcoin (BTC) is defending its mid-zone around $70,000, while traders are watching for a possible “flush-and-reclaim” pattern (selling pressure then recovery), a new crossover signal on ISM new orders data, as well as a chart pattern that resembles Nvidia’s (NVDAX) pre-breakout structure.
Taken together, these signals suggest that volatility will occur first, followed by a possible price push towards $100,000-if Bitcoin manages to reclaim the area it broke through in the weekly close.
Then, how will the Bitcoin price move today?
Bitcoin Price Drops 4.62% in 24 Hours
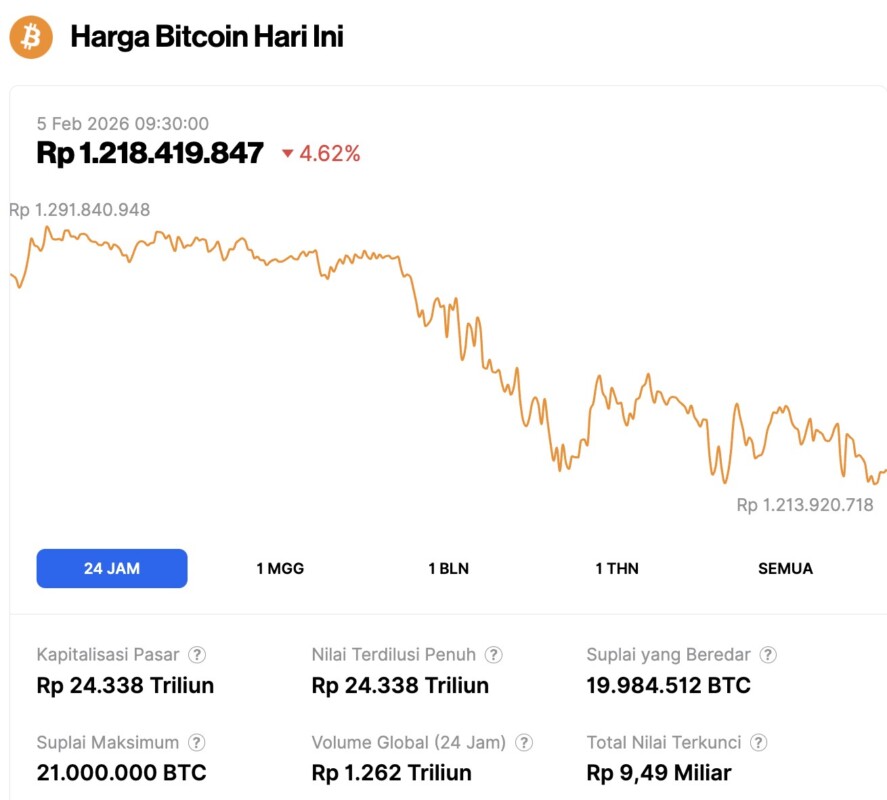
On February 5, 2026, Bitcoin was priced at $72,201, equivalent to approximately IDR 1,218,419,847, marking a 4.62% drop over the past 24 hours. During this period, BTC reached a low of IDR 1,213,920,718 and peaked at IDR 1,291,840,948.
At the time of writing, Bitcoin’s market capitalization is around IDR 24,338 trillion, while its 24-hour trading volume has declined by 0.26%, settling at IDR 1,262 trillion.
Read also: Bitcoin Falls Sharply: Crypto Winter Threat or Just a Cyclical Change?
Bitcoin Tests Support at $70,000 Range, Analysts Beware of “Break-and-Reclaim” Risk
Bitcoin is trading around $76,332 on Coinbase’s weekly chart as the price moves into an important support zone in the mid-$70,000 range. This level is within the previous consolidation area of 2024 which was then the starting point of the rally, so now the market is treating it as a decisive zone.
IncomeSharks warns that traders may focus too much on how strong this support looks. When a level becomes too crowded, prices often break through it to trigger stop-losses and force traders out of positions.
Such a move usually prints one sharp capitulation candle, while bearish targets such as $20,000, $40,000, or $50,000 start popping up on social media.
However, after the selling pressure, IncomeSharks expects a quick reversal. Chart projections suggest the price will drop past the support zone, then bounce back into the range, and then resume its rise towards $100,000.
In this scenario, Bitcoin is only considered to strengthen if it manages to reclaim the broken level and close the week above it – as it signals that sellers have lost control and buyers are back in control of the market.
Bitcoin follows ISM New Orders signal again, analysts highlight previous bull-run pattern
Bitcoin is in an interesting weekly pattern as analyst AO_btc_analyst highlights a recurring macro signal related to the ISM New Orders Index. In a post on February 3, the analyst mentioned that whenever the ISM index crosses a certain threshold, Bitcoin always enters a bull run phase – and now the signal has reappeared.
In the chart shown, Bitcoin’s long-term trend is mapped alongside the ISM New Orders line, complete with “bullish breakout” markers at several previous crossovers.
Read also: Ethereum Under Pressure: Vitalik Buterin Moves 5,493 ETH, Trend Research Releases 20 Thousand ETH
The signals coincide with periods of major Bitcoin rises, including in the 2013-2014 cycle, the 2017 rally, and the 2020-2021 cycle. The most recent circle appears in early 2026, when the ISM value is around 57.1 on the chart.
This setup shows that ISM crosses can be a trigger for risk-on appetite which often coincides with improving demand conditions. However, this signal does not guarantee the timing or magnitude of the move, as markets can be delayed in responding to macro data or affected by external shocks.
Even so, analysts argue that the reappearance of this signal increases the likelihood that Bitcoin will attempt a sustained upward phase from current levels.
Bitcoin and Nvidia Show Similar Breakout and Rebound Patterns on Weekly Charts
Meanwhile, analyst JamesEastonUK compared the structure of Bitcoin’s recent price movements to the pattern that formed in Nvidia stock before it experienced a sharp rally. In a February 3 post on X, he mentioned that Bitcoin’s price action looked similar to Nvidia’s pattern before the upward spike occurred.
A side-by-side comparison chart shows that both assets briefly moved in an upward channel, then broke the lower boundary of the channel before bouncing back. In the Bitcoin chart, the price twice tested the purple lower trendline (marked with white arrows), before finally surging upwards in a strong recovery phase.
On the Nvidia chart, the price also dropped past the lower line of the channel, then turned up and continued to press towards the upper boundary.
This comparison emphasizes technical structures rather than price levels. Both charts show the same sequence: upward channel → downward deviation → reclaim. Even so, this analysis remains a visual analog, as Bitcoin and Nvidia are affected by different factors, including market drivers, liquidity, and news cycles that are not the same.
Follow us on Google News to stay up to date with the latest in crypto and blockchain technology. Check Bitcoin price, usdt to idr and tokenized nvidia stock price through Pintu Market.
Enjoy an easy and secure crypto trading experience by downloading the Pintu crypto app via Play Store or App Store now. Also, experience web trading with advanced trading tools such as pro charting, various order types, and portfolio tracker only at Pintu Pro.
*Disclaimer
This content aims to enrich readers’ information. Pintu collects this information from various relevant sources and is not influenced by outside parties. Note that an asset’s past performance does not determine its projected future performance. Crypto trading activities are subject to high risk and volatility, always do your own research and use cold hard cash before investing. All activities of buying and selling Bitcoin and other crypto asset investments are the responsibility of the reader.
Reference:
- Coinpaper. Bitcoin Price Prediction: Three Bull Triggers Converge Near $75K Support. Accessed on February 5, 2026
Berita Terbaru
© 2026 PT Pintu Kemana Saja. All Rights Reserved.
Kegiatan perdagangan aset crypto dilakukan oleh PT Pintu Kemana Saja, suatu perusahaan Pedagang Aset Keuangan Digital yang berizin dan diawasi oleh Otoritas Jasa Keuangan serta merupakan anggota PT Central Finansial X (CFX) dan PT Kliring Komoditi Indonesia (KKI). Kegiatan perdagangan aset crypto adalah kegiatan berisiko tinggi. PT Pintu Kemana Saja tidak memberikan rekomendasi apa pun mengenai investasi dan/atau produk aset crypto. Pengguna wajib mempelajari secara hati-hati setiap hal yang berkaitan dengan perdagangan aset crypto (termasuk risiko terkait) dan penggunaan aplikasi. Semua keputusan perdagangan aset crypto dan/atau kontrak berjangka atas aset crypto merupakan keputusan mandiri pengguna.