Download Pintu App
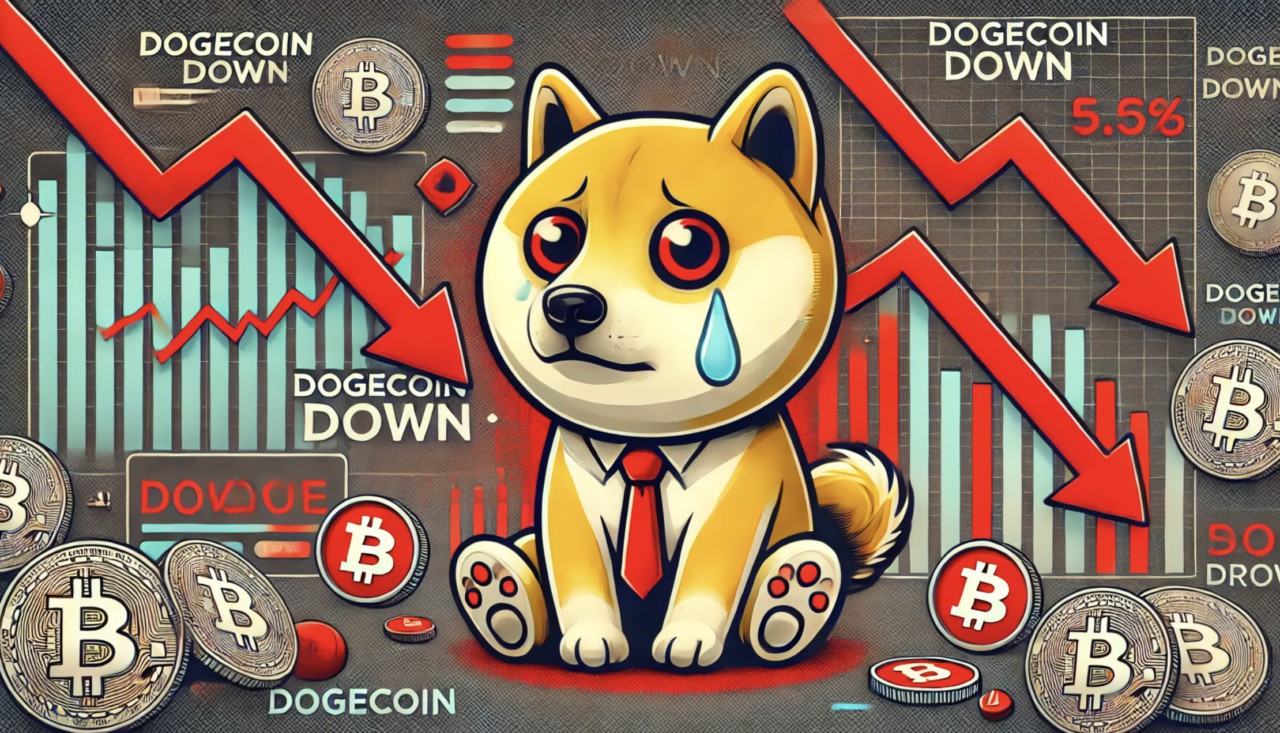
Dogecoin Slides 11% Despite a 36% Surge in Active Addresses
Jakarta, Pintu News – Dogecoin (DOGE) showed new movement both on-chain and on the chart simultaneously. The number of active addresses increased by 36% to over 71,400, while DOGE also returned to the long-term base zone on the weekly chart.
So, how is the Dogecoin price moving today?
Dogecoin price drops 11.88% in 24 hours
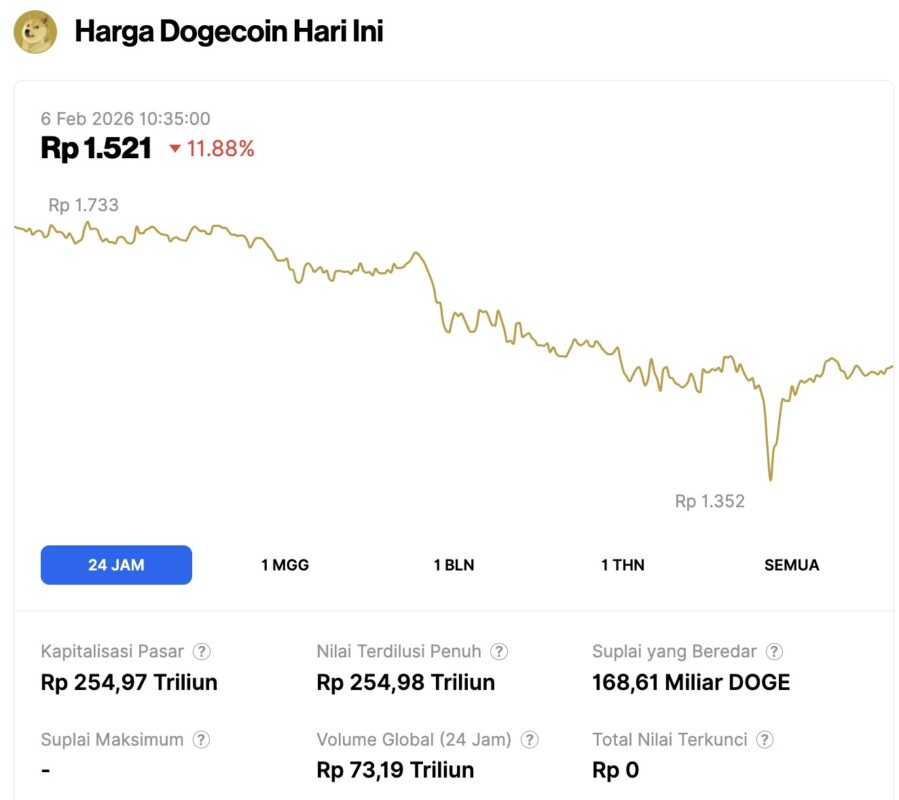
On February 6, 2026, Dogecoin saw a sharp 11.88% drop in price over a 24-hour period, falling to $0.08981 — approximately IDR 1,521. During that time, DOGE traded within a range of IDR 1,733 to IDR 1,352.
At the time of writing, Dogecoin’s market capitalization is around IDR 254.97 trillion, with a 24-hour trading volume of approximately IDR 73.19 trillion.
Read also: SpaceX 2027 Mission Funded by Dogecoin, Will DOGE Price Soar?
Dogecoin Active Addresses Jump 36% in a Week
Dogecoin network activity increased sharply in the past week, with the number of active addresses rising to over 71,400, according to data shared by market analyst Ali Charts. This update shows a 36% increase in DOGE network participation compared to the previous week, based on data from Santiment shown in the chart.
The chart shows the upward trend of Dogecoin active addresses from late January to early February. After a brief dip on January 25-26, activity began to increase consistently. On February 1, the number of active addresses rose from the 50,000s range to over 71,400. This was the highest weekly spike in address activity shown in the data snapshot.
This rise in active addresses indicates an increase in on-chain usage in a short period of time. As activity increases on a daily basis, the network is clearly registering an acceleration in interactions, not just a one-day spike. This movement comes as the market pays increasing attention to DOGE, which is reflected in the weekly spike in the number of active addresses.
Dogecoin Weekly Chart Shows Price Returning to the Base Zone
Meanwhile, Dogecoin price is seen returning to the long-term bottom zone on the weekly chart, based on a TradingView snapshot shared by Tardigrade Trader analysts at X.
Read also: Ethereum Crashes to $1,900 — Is a Bearish Trend Taking Over ETH?
The chart highlights that DOGE is again testing the horizontal support band around $0.10 after experiencing a prolonged downtrend from the 2024 peak. This bottom zone appears to be a repeated reaction area where the price previously consolidated before experiencing a spike.
The weekly chart structure shows that DOGE dropped from the 2024 highs in the range of $0.45-$0.48, then continued to weaken through a pattern of lower highs. As the price approached the highlighted bottom zone, the selling pressure started to ease and the candles started to narrow around that support area.
This pattern mirrors the previous period in the chart, where DOGE also got stuck at similar levels before resuming a sharp move in a certain direction.
The latest touch of this base zone signaled a retest of long-term support on the weekly time frame. The structure shows several historical reactions in this area, where the price has consistently stabilized after a decline. The chart depicts the current price movement as a return of the DOGE to the previous accumulation area, not just a momentary correction.
Follow us on Google News to stay up to date with the latest in crypto and blockchain technology. Check Bitcoin price, usdt to idr and tokenized nvidia stock price through Pintu Market.
Enjoy an easy and secure crypto trading experience by downloading the Pintu crypto app via Play Store or App Store now. Also, experience web trading with advanced trading tools such as pro charting, various order types, and portfolio tracker only at Pintu Pro.
*Disclaimer
This content aims to enrich readers’ information. Pintu collects this information from various relevant sources and is not influenced by outside parties. Note that an asset’s past performance does not determine its projected future performance. Crypto trading activities are subject to high risk and volatility, always do your own research and use cold hard cash before investing. All activities of buying and selling Bitcoin and other crypto asset investments are the responsibility of the reader.
Reference:
- Coinpaper. Dogecoin Surges: Active Addresses Jump 36%, DOGE Price Hits Base. Accessed on February 6, 2026
Berita Terbaru
© 2026 PT Pintu Kemana Saja. All Rights Reserved.
Kegiatan perdagangan aset crypto dilakukan oleh PT Pintu Kemana Saja, suatu perusahaan Pedagang Aset Keuangan Digital yang berizin dan diawasi oleh Otoritas Jasa Keuangan serta merupakan anggota PT Central Finansial X (CFX) dan PT Kliring Komoditi Indonesia (KKI). Kegiatan perdagangan aset crypto adalah kegiatan berisiko tinggi. PT Pintu Kemana Saja tidak memberikan rekomendasi apa pun mengenai investasi dan/atau produk aset crypto. Pengguna wajib mempelajari secara hati-hati setiap hal yang berkaitan dengan perdagangan aset crypto (termasuk risiko terkait) dan penggunaan aplikasi. Semua keputusan perdagangan aset crypto dan/atau kontrak berjangka atas aset crypto merupakan keputusan mandiri pengguna.