Download Pintu App
Ethereum Holds Steady at $2,000, but Bears Still Control the Trend
Jakarta, Pintu News – Ethereum’s near-term outlook remains fragile as traders weigh technical pressure versus improving on-chain data. Furthermore, recent market behavior suggests a consolidation phase, not a recovery, as sellers are still actively defending price levels above.
As a result, analysts think the potential for price increases is still limited unless ETH is able to show strength by breaking and holding above the nearest resistance zone. Then, how will Ethereum (ETH) price move today?
Ethereum Price Drops 2.18% in 24 Hours
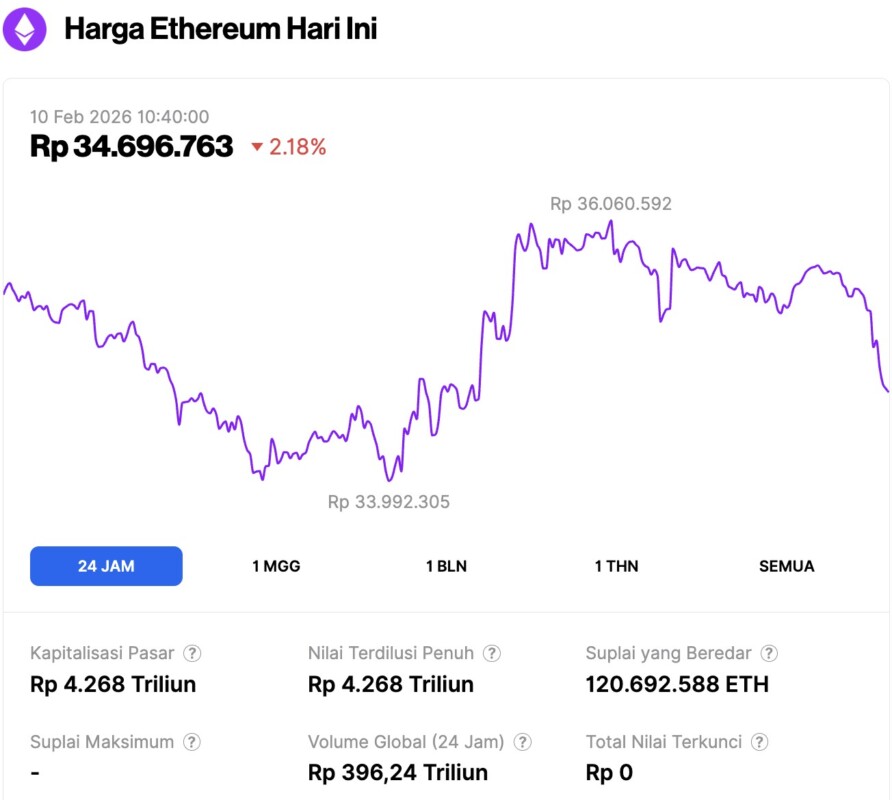
On February 10, 2026, Ethereum was trading at around $2,060, or roughly IDR 34,696,763, marking a 2.18% decline over the past 24 hours. During that period, ETH slipped to a low of IDR 33,992,305 and climbed to a high of IDR 36,060,592.
At the time of writing, Ethereum’s market capitalization is approximately IDR 4,268 trillion, while its daily trading volume has increased by 21% to around IDR 396.24 trillion in the last 24 hours.
Read also: Bitcoin Price Freefalls to $69,000 Today: Analysts See a Potential BTC Peak Forming
Short-term Structure Still Favoring Bears
Ethereum’s 4-hour structure (9/2) still shows a controlled downtrend, with the price staying below the main channel. The rebound from the $1,860 low has so far not been followed by convincing further gains and looks more like a corrective move.
In addition, ETH continues to be stuck below the center area of the channel, which hints at weak demand whenever the price tries to rise. This pattern suggests that traders are still inclined to sell as the price rallies, rather than chasing a breakout. Therefore, the broader structure is still in favor of sellers as long as the price is held below $2,150.
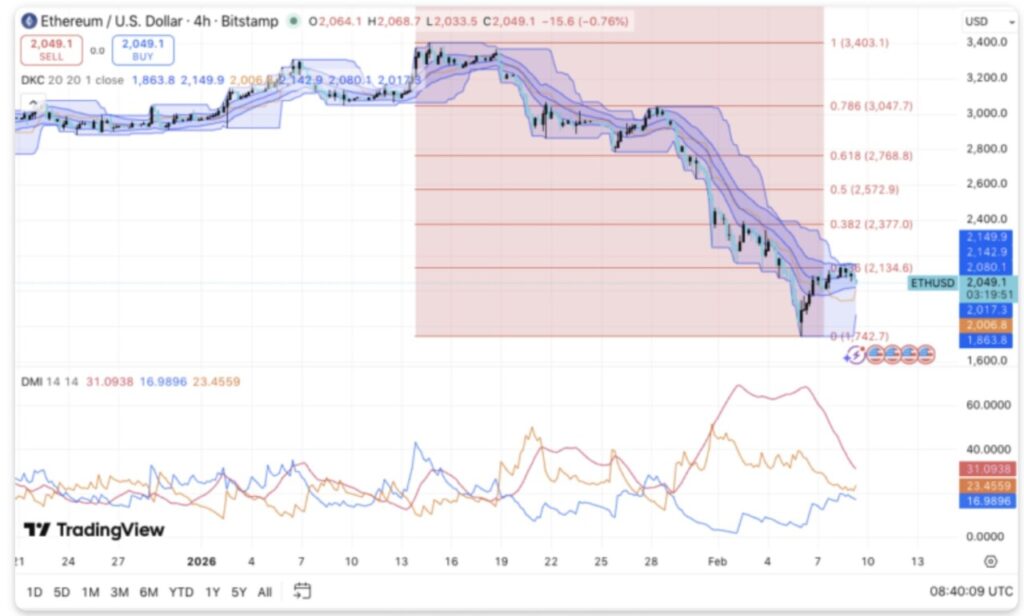
The resistance level is still clear and technically important. The $2,135-$2,150 area continues to act as the first rejection zone. Above it, the 0.382 Fibonacci level around $2,377 becomes a meaningful initial obstacle for momentum improvement.
Higher, the $2,573 area coincides with the 0.5 retracement and the previous supply zone. Most crucially, the 0.618 retracement around $2,768 remains the key level that the bears need to break if their dominance is to end.
On the downside, ETH still holds short-term support in the range of $2,000-$2,020. This zone has psychological weight and is relevant for intraday movements. If this area is broken, prices could potentially retest the latest swing low near $1,863.
Further down, the $1,740 area is the last major demand zone of this series of declines. A move towards that level would confirm the continuation of the downtrend.
The momentum indicators are also still favoring the bearish scenario. The DMI data shows that the ADX value is around 31, signaling a fairly strong trend. Meanwhile, the negative line (DI-) is still above the positive line (DI+). As a result, momentum control remains in the hands of sellers even though recent price movements tend to be sideways.
Derivatives and Spot Flows Add Context
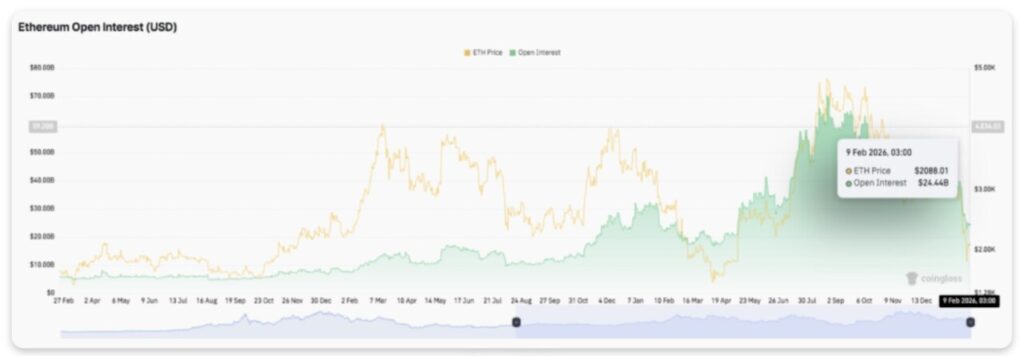
Ethereum’s open interest data shows a repeating pattern of expansion and reset. Open interest tends to increase when the price rises, reflecting the increased use of leverage. When there is a sharp decline, the market then experiences rapid liquidation and closure of positions.
Read also: Vitalik Buterin Goes All-Out to Support Zcash with Big Steps in the Privacy Realm
Recently, open interest has fallen quite sharply from high levels. This decline points more towards a broader deleveraging phase, rather than a market panic. As such, the near-term liquidation risk appears lower.
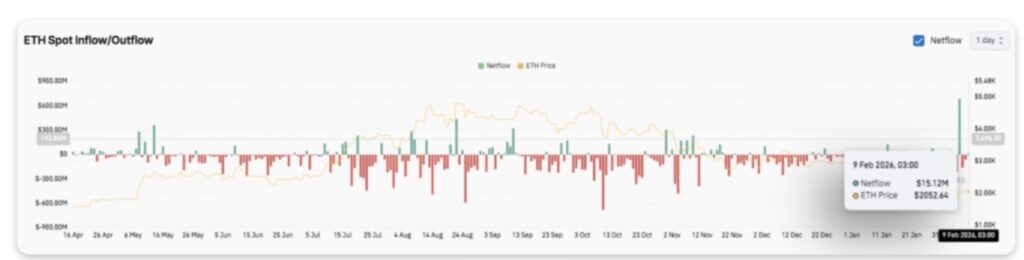
On the other hand, spot flow data gives a slightly different feel. Exchange outflows dominated for a long period of time. These outflows indicate “hold” behavior and reduced supply circulating in the market.
However, recently the net flow has started to narrow and move closer to neutral. This shift reflects more of a balanced condition rather than aggressive accumulation. In addition, the latest inflow is still relatively small, signaling caution at current price levels.
Ethereum Price Technical Outlook
Key levels for Ethereum are still evident while the market is in a fragile recovery phase.
On the upside, the $2,135 and $2,150 areas are the initial hurdles that need to be broken. If the price is able to break and confirm a break above this zone, upside room could open up towards $2,377, then $2,573 if momentum strengthens.
Meanwhile, a crucial resistance area remains around $2,768, which needs to be broken and turned into support to confirm a potential broader trend change.
On the downside, the $2,000-$2,020 zone serves as short-term support as well as an important psychological level. If this area is broken, ETH has the potential to weaken again towards $1,863. Below that, the $1,740 area is the last major demand zone in this downward phase.
Technically, the price structure still suggests that Ethereum is in a corrective phase within a larger downtrend. Price is still moving below key Fibonacci levels and descending channel resistance, so any upside attempts remain vulnerable to being stifled.
Momentum indicators still tend to favor sellers, although the latest consolidation phase is starting to hint at a slowdown in downward pressure.
Follow us on Google News to stay up to date with the latest in crypto and blockchain technology. Check Bitcoin price, usdt to idr and tokenized nvidia stock price through Pintu Market.
Enjoy an easy and secure crypto trading experience by downloading the Pintu crypto app via Play Store or App Store now. Also, experience web trading with advanced trading tools such as pro charting, various order types, and portfolio tracker only at Pintu Pro.
*Disclaimer
This content aims to enrich readers’ information. Pintu collects this information from various relevant sources and is not influenced by outside parties. Note that an asset’s past performance does not determine its projected future performance. Crypto trading activities are subject to high risk and volatility, always do your own research and use cold hard cash before investing. All activities of buying and selling Bitcoin and other crypto asset investments are the responsibility of the reader.
Reference:
- CoinEdition. Ethereum Price Prediction: ETH Consolidates After Sell-Off, But Bears Still Control the Trend. Accessed on February 10, 2026
Berita Terbaru
© 2026 PT Pintu Kemana Saja. All Rights Reserved.
Kegiatan perdagangan aset crypto dilakukan oleh PT Pintu Kemana Saja, suatu perusahaan Pedagang Aset Keuangan Digital yang berizin dan diawasi oleh Otoritas Jasa Keuangan serta merupakan anggota PT Central Finansial X (CFX) dan PT Kliring Komoditi Indonesia (KKI). Kegiatan perdagangan aset crypto adalah kegiatan berisiko tinggi. PT Pintu Kemana Saja tidak memberikan rekomendasi apa pun mengenai investasi dan/atau produk aset crypto. Pengguna wajib mempelajari secara hati-hati setiap hal yang berkaitan dengan perdagangan aset crypto (termasuk risiko terkait) dan penggunaan aplikasi. Semua keputusan perdagangan aset crypto dan/atau kontrak berjangka atas aset crypto merupakan keputusan mandiri pengguna.