Download Pintu App
Ethereum Slides to $1,900: Is Major Institutional Support Starting to Crumble?
Jakarta, Pintu News – Ethereum (ETH) price fell more than 5% in recent days and has now broken below one of the important short-term structural levels. On February 10, ETH fell below $1,980 after failing to sustain a rebound move inside a narrow channel.
This decline came after DeFi activity fell sharply and institutional fund inflows weakened. However, amidst this pressure, large holders have started to accumulate again. The question is simple: is this a sign of the beginning of a new accumulation phase, or just a brief pause before the price drops even further?
Ethereum Price Drops 2.43% in 24 Hours
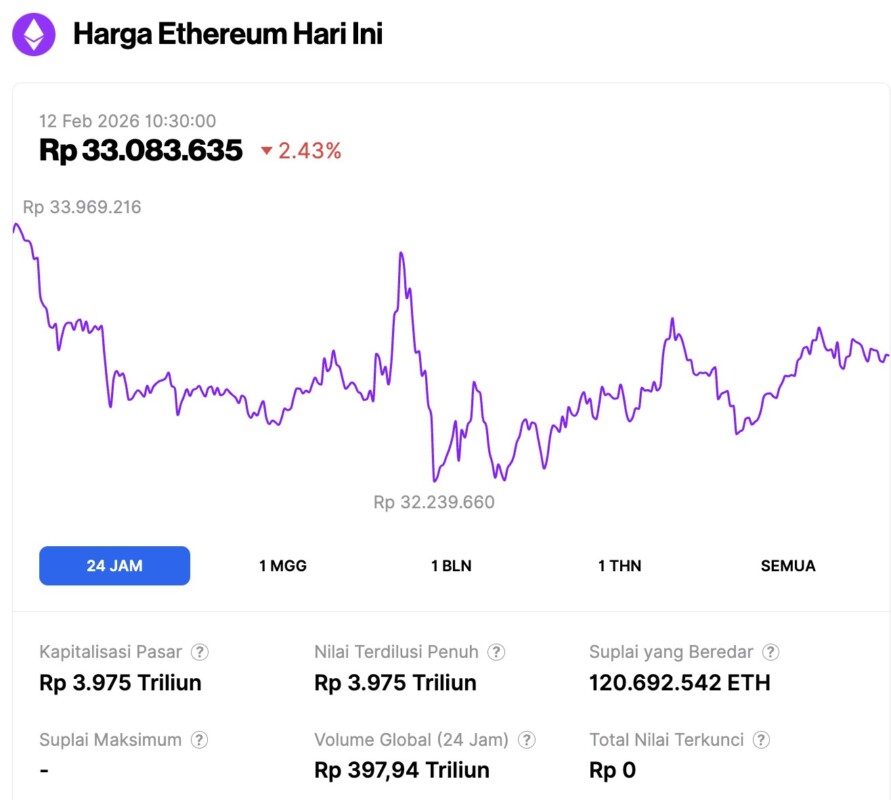
On February 12, 2026, Ethereum was trading at around $1,960, or approximately IDR 33,083,635, marking a 2.43% decline over the past 24 hours. Within that time frame, ETH slipped to a low of about IDR 32,239,660 and climbed to a high near IDR 33,969,216.
At the time of writing, Ethereum’s market capitalization is around IDR 3,975 trillion, while its daily trading volume has increased by 4% over the last 24 hours to roughly IDR 397.94 trillion.
Read also: XRP Price Prediction: Consolidation After Sell-off, Market Confidence Starting to Fade?
Pattern Broken, Confirming Weak “Big Money” Support
Ethereum’s rebound in early February was actually formed inside a bear flag pattern. This structure is more like a short-term recovery attempt, rather than a strong trend reversal. On February 10, the price broke below the lower boundary of the flag, triggering a pattern break that could potentially open the door to a decline of more than 50%, as predicted in our previous Ethereum analysis.
This movement is important as it coincides with weak fund flows.
The Chaikin Money Flow (CMF) indicator is used to measure whether capital is moving in or out of an asset, utilizing price and volume data. When the CMF moves above zero, it usually signals large-scale institutional buying. If it stays below zero, it indicates weak market participation.
Between February 6-9, ETH prices did rally, but the CMF never managed to break above the zero level. It also failed to break out of the downtrend line. This means that the price increase was not strongly supported by major market participants.
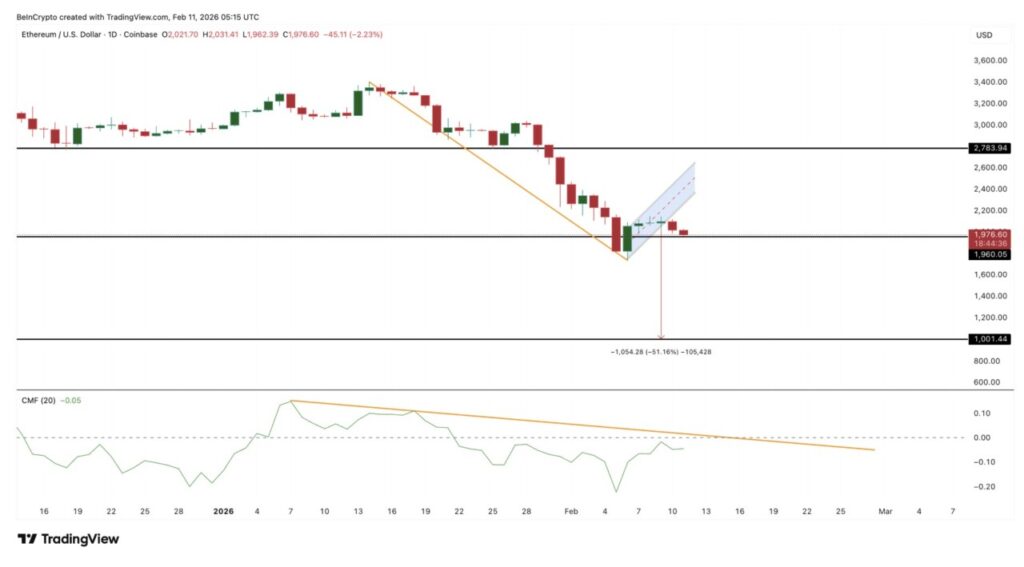
Simply put, the price went up, but the “serious money” didn’t really come in. Rebounds that aren’t backed by a strong CMF are usually short-lived-and that’s exactly what happened. As soon as the buying pressure weakened, sellers regained control of the market and pushed ETH prices lower.
This confirms that the pattern break is not just a random move. It was most likely driven by the weakening of large fund inflows. However, technical weakness alone is not enough to explain the entire situation.
Structural Issues Seen in TVL’s DeFi and Flow to Exchanges
There is a deeper issue behind Ethereum’s DeFi activity. Total Value Locked (TVL) measures how much funds are stored on a decentralized finance platform. It reflects real usage, capital commitment, and long-term trust levels. When TVL goes up, it means that users are locking up their funds. When TVL goes down, capital is being exited.
BeInCrypto website analysts combined TVL data and exchange inflows and outflows to show one clear pattern. On November 13, DeFi’s TVL was around $75.6 billion. At the same time, ETH was trading around $3,232.
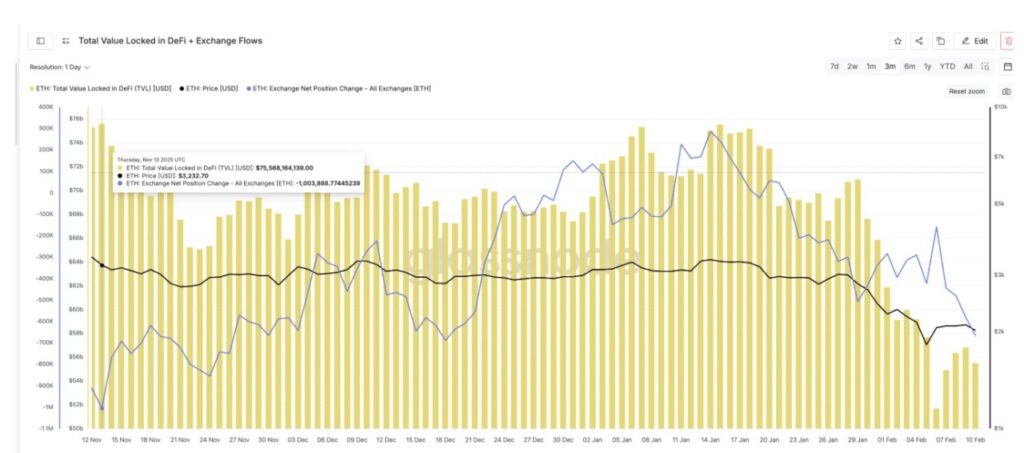
The net position of ETH on exchanges (exchange net position change) is very negative, meaning that more coins are leaving the exchange than entering. Possibly, investors are moving ETH to their personal wallets (self-custody). That is a healthy condition.
However, on December 31, TVL dropped to around $67.4 billion. ETH price also corrected to $2,968. Flows to the exchanges turned positive. About 1.5 million ETH entered the exchange, signaling increased selling pressure. Then we look at the February data.
Read also: TON Foundation Launches TON Pay, What Makes It Different?
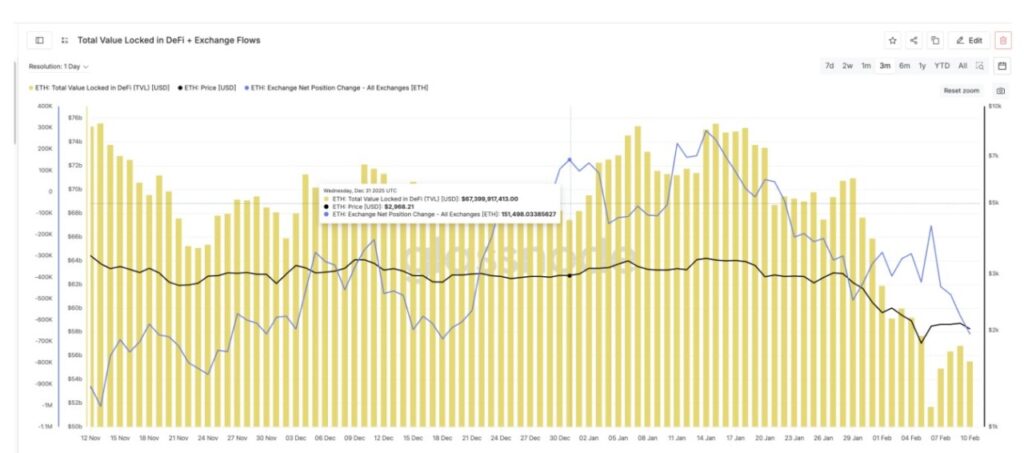
On February 6, DeFi’s TVL touched a three-month low of $51.7 billion, while ETH was around $2,060. Outflows from exchanges weakened sharply (the Net Position line touched a local peak). Although net position is still slightly negative, buying pressure is collapsing, as illustrated by the February 6 peak. This shows a repeating pattern:
As TVL falls, inflows to the exchange tend to rise or outflows weaken. This means that capital moves from long-term use (e.g. DeFi) towards positions that are ready to be sold.
As of February 10, TVL had only recovered to around $55.5 billion, still down nearly $20 billion from its mid-November level. It is also still close to a three-month low. Without a stronger TVL recovery, selling pressure from the exchange side is likely to emerge again.
So, the pattern break in price occurred at a time when Ethereum’s core usage was still weak.
That’s a structural problem, not just a chart pattern problem.
Whale Accumulation and Cost Basis Explain Ethereum Price Support Area
Although the technical signals are weakening and TVL continues to decline, the whales have not really exited completely.
Whale supply measures how much ETH is held by large (off-exchange) wallets. Since February 6, whale holdings dropped from around 113.91 million ETH to approximately 113.56 million ETH, confirming a distribution (sell) at the price breakdown. However, in the last 24 hours, this trend stopped.
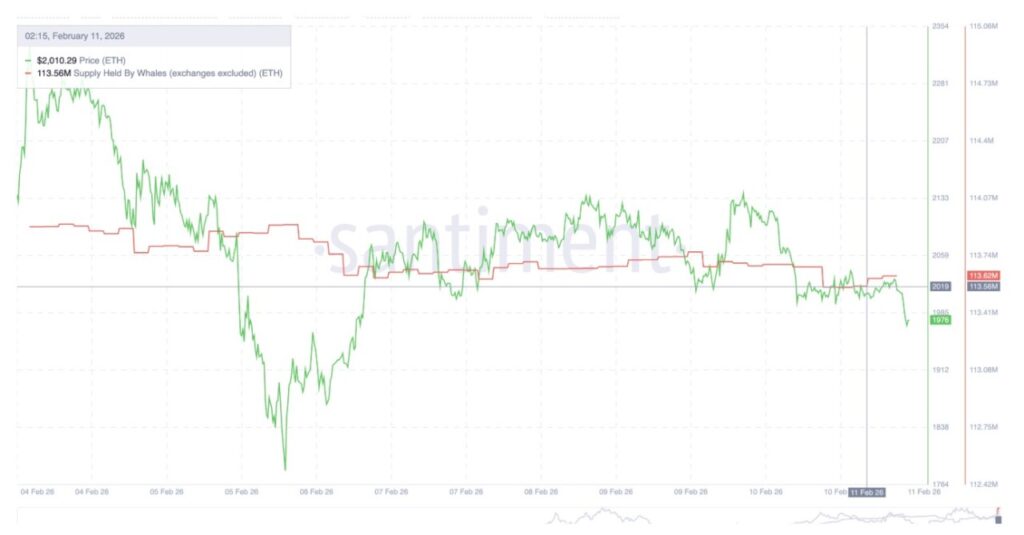
Holdings actually edged up from 113.56 million ETH to 113.62 million ETH, signaling small accumulations. This signals that the whales are “testing” the support area, rather than entering in a big way.
The reason is obvious when we look at the cost basis data.
The cost basis heatmap shows in what price range large investor groups buy their coins. These zones often act as support as holders tend to defend their entry price. For Ethereum, there was one large cluster in the $1,879 – $1,898 range. About 1.36 million ETH were bought in this area. That makes it a strong demand zone.
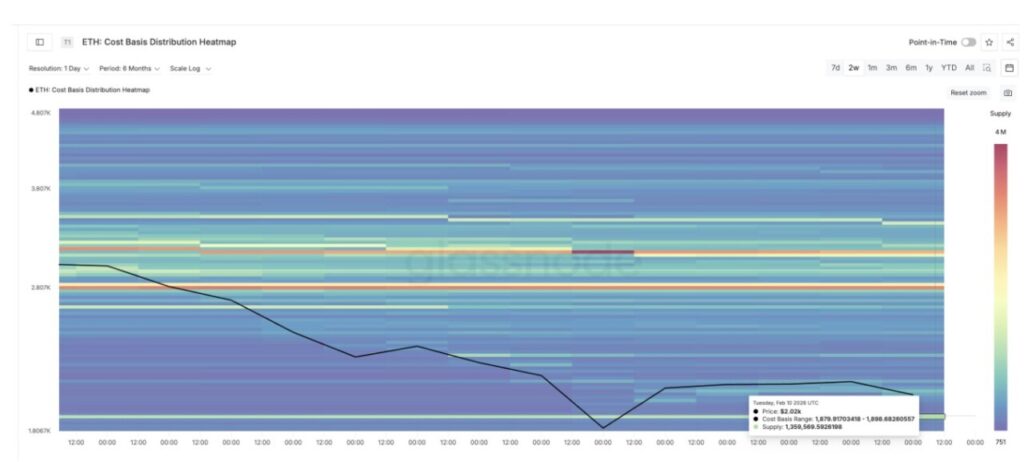
The price is currently moving just above that area.
As long as ETH stays above this band, the whales have a reason to hold on to it. If the price falls below, many holders will start losing money and that could potentially trigger more selling pressure. This explains why the buying is still cautious.
The Whale is not placing bets for a big rally, but is likely protecting a critical cost base zone.
From here, Ethereum’s price structure becomes clearer:
- The key support is around $1,960 and then $1,845.
- A daily close below $1,845 will break the key cost cluster and confirm the risk of a deeper drop. If that happens, the next downside zones are near $1,650 and $1,500.
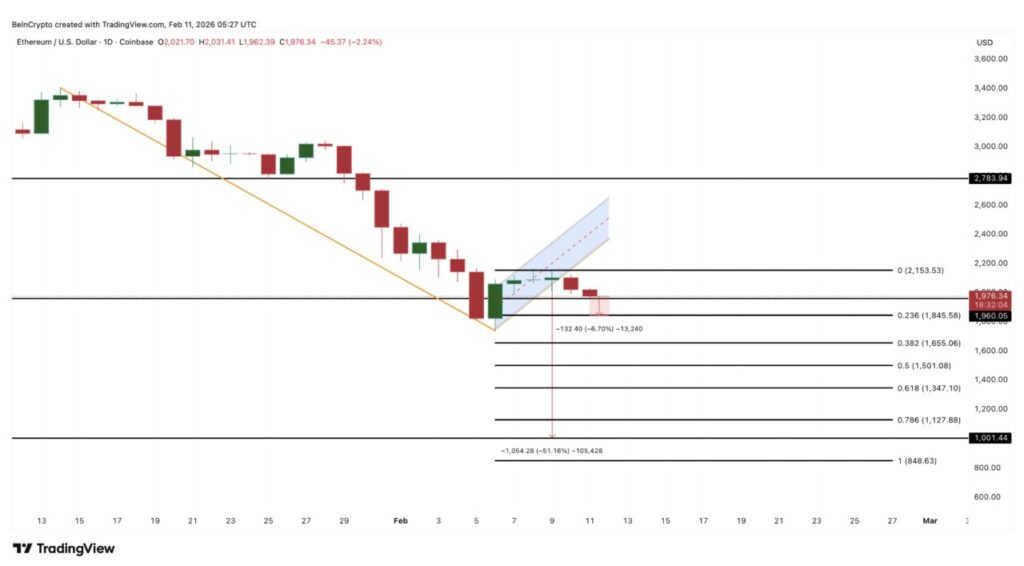
On the top side:
- ETH needs to reclaim the level around $2,150 to start stabilizing the structure.
- Only if the price manages to break above $2,780, the greater bearish pressure starts to weaken.
Until that is achieved, any rebound is still likely to be fragile and prone to failure.
Follow us on target="_blank" rel="noreferrer noopener" href="https://news.google.com/u/2/publications/CAAqBwgKMKXoywsw1YPjAw?hl=id&gl=ID&ceid=ID%3Aid">Google News to stay up to date with the latest in crypto and blockchain technology. Check Bitcoin price, usdt to idr and tokenized nvidia stock price through Pintu Market.
Enjoy an easy and secure crypto trading and crypto gold investment experience by downloading the Pintu crypto app via Play Store or App Store now. Also, experience web trading with advanced trading tools such as pro charting, various order types, and portfolio tracker only at Pintu Pro.
*Disclaimer
This content aims to enrich readers’ information. Pintu collects this information from various relevant sources and is not influenced by outside parties. Note that an asset’s past performance does not determine its projected future performance. Crypto trading activities are subject to high risk and volatility, always do your own research and use cold hard cash before investing. All activities of buying and selling Bitcoin and other crypto asset investments are the responsibility of the reader.
Reference:
- BeInCrypto. Ethereum (ETH) Breaks Pattern Amid $20 Billion DeFi Slide – Why Are Whales Still Buying? Accessed on February 12, 2026
Berita Terbaru
© 2026 PT Pintu Kemana Saja. All Rights Reserved.
Kegiatan perdagangan aset crypto dilakukan oleh PT Pintu Kemana Saja, suatu perusahaan Pedagang Aset Keuangan Digital yang berizin dan diawasi oleh Otoritas Jasa Keuangan serta merupakan anggota PT Central Finansial X (CFX) dan PT Kliring Komoditi Indonesia (KKI). Kegiatan perdagangan aset crypto adalah kegiatan berisiko tinggi. PT Pintu Kemana Saja tidak memberikan rekomendasi apa pun mengenai investasi dan/atau produk aset crypto. Pengguna wajib mempelajari secara hati-hati setiap hal yang berkaitan dengan perdagangan aset crypto (termasuk risiko terkait) dan penggunaan aplikasi. Semua keputusan perdagangan aset crypto dan/atau kontrak berjangka atas aset crypto merupakan keputusan mandiri pengguna.