Download Pintu App
Pi Network Price Prediction: Pi Coin Price Narrows Ahead of 173 Million Token “Unlock”
Jakarta, Pintu News – The Pi Network trades under pressure as weakening technical indicators coincide with a consistent increase in circulating supply. On the 4-hour chart (Feb 24), PI/USDT remains in a broader downtrend despite a sharp recovery from recent lows.
Price action is now narrowing (compressing) below the majormoving average lines, while the upcoming tokenunlock plan is adding to the uncertainty. Therefore, traders are now monitoring the dynamics of the market structure and supply to determine the direction of the next move.
Price Structure Signals Bearish Bias
PI has just completed a full retracement towards $0.1304 after dropping from the Fibonacci 1.0 level around $0.2124. The decline had triggered aV-shaped recovery.
Read also: 1 Year Anniversary, Pi Network Unveils Big Strategy and 2026 Expansion Plans
However, the rebound attempt stalled near $0.1948, which aligned with the 0.786 Fibonacci level. A strongrejection followed afterward, thus strengthening the resistance in the upper area.
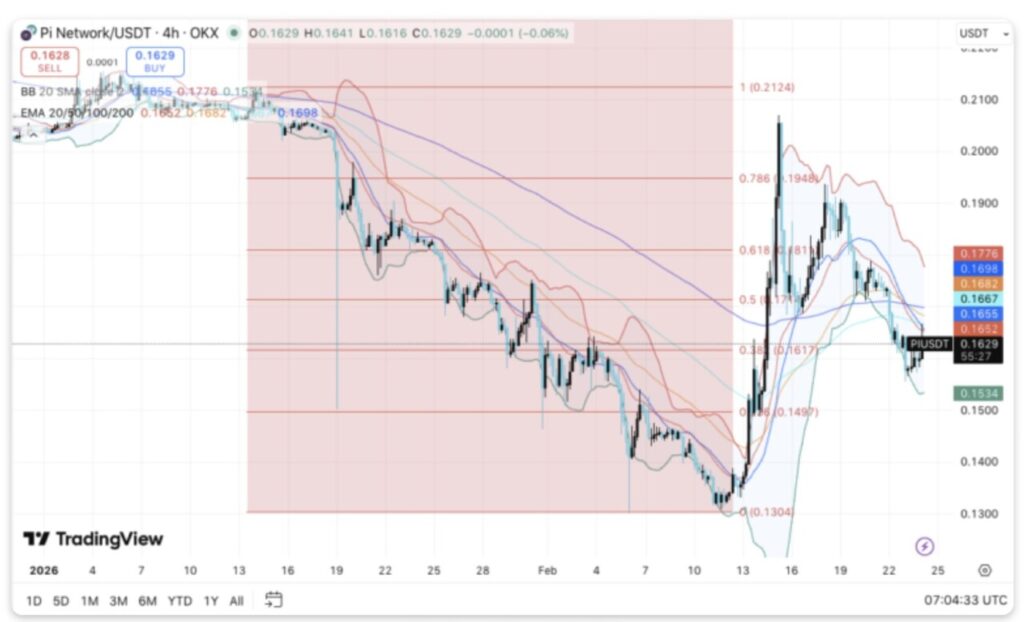
Since the rejection, the price moved down and is now trading around $0.1629. Thecluster of EMAs between $0.1655 and $0.1698 acts as the closest resistance. Significantly, the price remains stuck below the 200 EMA, which keeps the short-term trend leaningdownward.
The immediate resistance is between $0.1682 to $0.1698. Above that level, $0.1776 marks the upper Bollinger resistance as well as the previous price structure. The $0.1811 level, which aligns with the 0.618 Fibonacci retracement, becomes the next barrier.
On the downside, $0.1534 serves as the firstdemand zone. If that level is broken, the price risks heading towards $0.1497, which is then followed by themajor swing low at $0.1304.
Moreover, the narrowing of the Bollinger Bands indicator indicates compression, which is often a precursor to price expansion. Unless the bulls are able to reclaim the $0.1698 to $0.1776 area, the market control will still be held bysellers.
Token Unlock Adds to Supply Pressure
In addition to technical resistance, tokenunlocks may influence short-term sentiment. Data updated on February 24, 2026 shows that a total of 5.39 billion Pi is still in locked status. The supply is estimated to have a value close to $878 million.
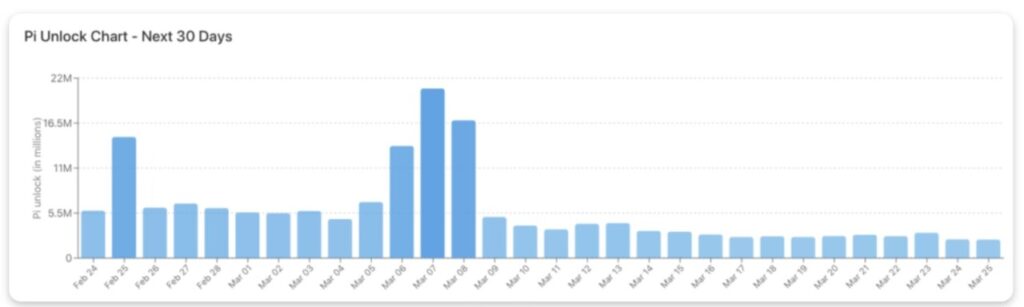
Over the next 30 days, a total of 173.12 million Pi will be unlocked. This is equivalent to about 3.21% of the total locked supply. As a result, the average daily unlocking reaches about 5.77 million Pi. The largest daily release is scheduled for March 7, the volume of which could exceed 20.7 million tokens.
Read also: 3 Major Token Unlocks Worth Watching This Week, Potentially Up or Down?
This unlocking process will gradually expand thecirculating supply. However, unreleased Pibalances beyond claimable balances remain unmonitored. Therefore, traders should monitor shifts in liquidity very closely.
Network Growth Outpaces Market Reaction
In addition, network metrics show continued expansion of the ecosystem. More than 16.2 million users have migrated to the mainnet, and approximately 17.7 million users have completed KYC verification. The network now supports more than 300 mainnet applications and 421,000 active nodes.
Data from Map of Pi records 148,000 sellers and 2.1 million local users. In addition, users have staked more than 111 million Pi to support the ranking of applications. Despite this massive growth, the price performance has not reflected this level of adoption.
Pi Network (PI) Technical Projection
Key levels remain clearly defined for Pi Network as the price moves inside a broader corrective structure. On the 4-hour chart, PI continues to compress below its 200 EMA, signaling momentum caution.
- Upside: The closest resistance is in the $0.1682-$0.1698 range, where the EMAcluster meets. A sustained break above this zone could open the door towards $0.1776. Above that, the $0.1811 level (aligned with Fibonacci 0.618) becomes the next major obstacle. If the bullish momentum strengthens, the price could potentially retest the Fibonacci 0.786 rejection zone at $0.1948.
- Downside: Initial support is at $0.1534, which is a recent area ofdemand. Below that, the $0.1497 level marks the 0.236 Fibonacci retracement. Failure to hold this region will increase the probability of a retest to themajor swing low at $0.1304. A break below that level would confirm a continuation of the broader downtrend.
- Key Resistance Limits: The 200 EMA and the $0.1698 zone represent key levels that must be recaptured for medium-term stabilization. Without a move settling above this cluster, any price increase is likely to be corrective only.
Technically, the Bollinger Bands indicator continues to narrow, reflecting volatility compression. Suchsetups are often a precursor to price expansion in either direction.
However, the current structure is still leaning towards a bearish bias unless the buying side is able to reclaim the structure’s higher levels.
Will Pi Network Turn Stronger?
Pi’s short-term projection relies heavily on the bulls ‘ ability to defend the $0.1534 level while building pressure towards the resistancecluster at $0.1698.
Strongerinflows and less selling pressure from the upcoming token unlock agenda could support price recovery towards $0.1776 and $0.1811 levels.
Conversely, a decisive break below $0.1534 will most likely shift the market focus back to the $0.1304 level. For now, the PI is trading at apivotal level, where technical compression and supply dynamics will be the determining factors for the direction of the next move.
Follow us on target="_blank" rel="noreferrer noopener" href="https://news.google.com/u/2/publications/CAAqBwgKMKXoywsw1YPjAw?hl=id&gl=ID&ceid=ID%3Aid">Google News to stay up to date with the latest in crypto and blockchain technology. Check Bitcoin price, usdt to idr and tokenized nvidia stock price through Pintu Market.
Enjoy an easy and secure crypto trading and crypto gold investment experience by downloading the Pintu crypto app via Play Store or App Store now. Also, experience web trading with advanced trading tools such as pro charting, various order types, and portfolio tracker only at Pintu Pro.
*Disclaimer
This content aims to enrich readers’ information. Pintu collects this information from various relevant sources and is not influenced by outside parties. Note that an asset’s past performance does not determine its projected future performance. Crypto trading activities are subject to high risk and volatility, always do your own research and use cold hard cash before investing. All activities of buying and selling Bitcoin and other crypto asset investments are the responsibility of the reader.
Reference:
- CoinEdition. Pi Network Price Prediction: PI Price Compresses as 173M Tokens Near Unlock. Accessed on February 25, 2026
Berita Terbaru
© 2026 PT Pintu Kemana Saja. All Rights Reserved.
Kegiatan perdagangan aset crypto dilakukan oleh PT Pintu Kemana Saja, suatu perusahaan Pedagang Aset Keuangan Digital yang berizin dan diawasi oleh Otoritas Jasa Keuangan serta merupakan anggota PT Central Finansial X (CFX) dan PT Kliring Komoditi Indonesia (KKI). Kegiatan perdagangan aset crypto adalah kegiatan berisiko tinggi. PT Pintu Kemana Saja tidak memberikan rekomendasi apa pun mengenai investasi dan/atau produk aset crypto. Pengguna wajib mempelajari secara hati-hati setiap hal yang berkaitan dengan perdagangan aset crypto (termasuk risiko terkait) dan penggunaan aplikasi. Semua keputusan perdagangan aset crypto dan/atau kontrak berjangka atas aset crypto merupakan keputusan mandiri pengguna.