Download Pintu App
Solana (SOL) Ready to Soar? $3.78M ETF Inflow Pushes Price to $90!
Jakarta, Pintu News – Solana (SOL) price briefly moved around $81.73, up 0.53% in February 25 after successfully holding the $76-$77 support zone. This bounce returned control of the short-term structure to the buyers, as institutional flows reversed and positioning changes in the derivatives market moved increasingly towards the accumulation phase.
ETF Inflows Return After Several Weeks of Distribution Phase
After several days of institutional outflows, the Solana spot ETF recorded net inflows of $3.78 million on February 24, according to SoSoValue data. This change in direction was the first session with positive flows, after selling pressure had pushed prices down to cross a number of important moving averages.
Read also: Pi Network Still Holding Important Support, but Bearish Signal Getting Clearer?
In terms of contributors, Bitwise’s BSOL led the way with inflows of $2.62 million, followed by Fidelity’s FSOL at $1.16 million. A shift from outflows to inflows generally indicates institutions’ assessment that current price levels are starting to become attractive for accumulation, especially after a relatively long correction period.
Cumulatively, net inflows now stand at $901.25 million, equivalent to about 1.56% of Solana’s market capitalization. When ETF flows turn positive again along with the price’s ability to hold the support area, it is often seen as forming a “floor” for the next move, as institutional capital tends to absorb selling pressure from leveraged traders and short-term holders.
Derivative Positions Strengthen in Bullish Direction as Longs Increase
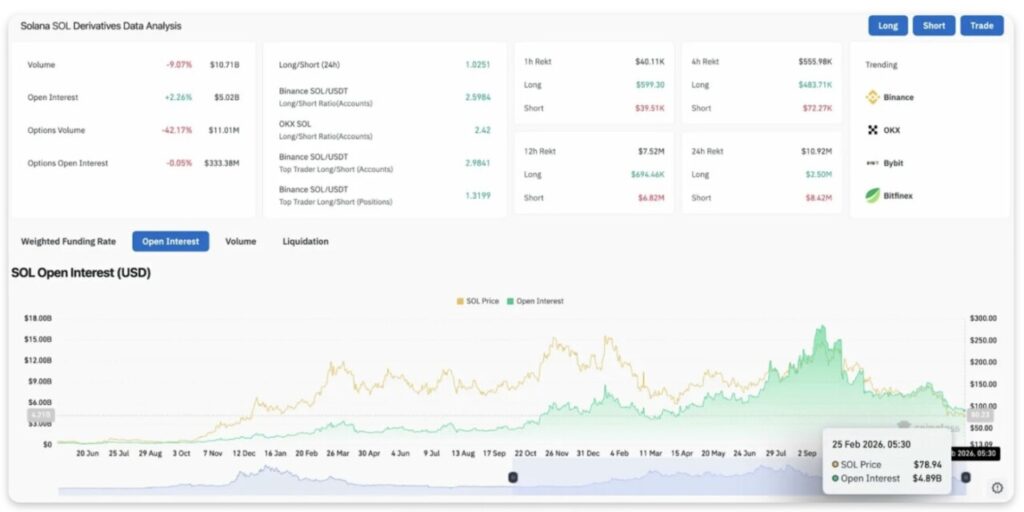
In the derivatives market, open interest rose 2.26% to $5.02 billion. This increase shows that market participants tend to add exposure following price bounces, instead of closing positions. Meanwhile, volume fell 9.07% to $10.71 billion, a common pattern in the consolidation phase when prices begin to stabilize before determining the direction of further movement.
The long/short ratio on Binance stands at 2.59 for general accounts and 2.98 for the top trader category, reflecting the dominance of long positions. This composition differs from bearish breakdown scenarios that are usually characterized by short dominance. The long bias hints at the expectation that the low in the $76 area will hold, while opening up the opportunity for a retest of the resistance area.
The 4-hour and 24-hour liquidation data (25/2) shows a total liquidation of around $555.98K, with the largest portion coming from shorts at $483.71K. The sweep of shorts after the bounce from the $76 area reduces short-term resistance and, in a technical context, could potentially ease the price push through the $80-$83 range.
Bollinger Bands Experience Squeeze Near Support as Volatility Narrows
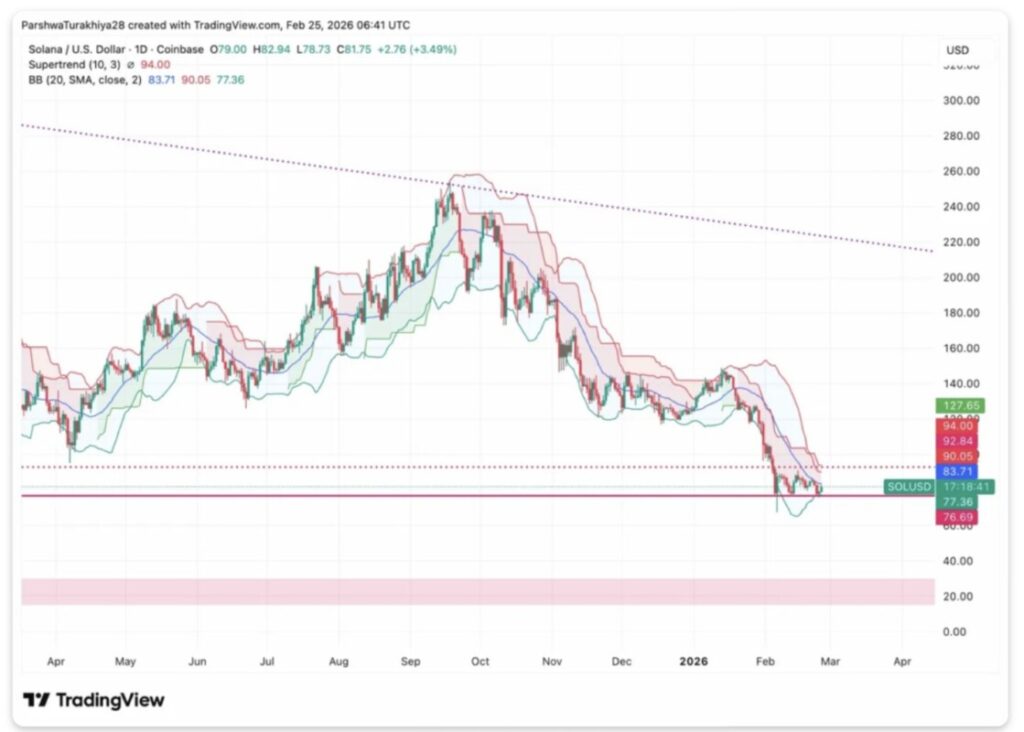
The daily chart shows Solana moving between the lower Bollinger Band at $77.36 and the middle band at $90.05. The Supertrend indicator is still red at $94.00, which confirms the trend on the higher timeframes is still bearish despite the intraday bounce.
Read also: Ethereum Reclaims $2,000 as Whales Accumulate $18 Billion ETH Position
However, the structure is starting to change. In the past week, Solana managed to defend the $76 area three times, thus forming a higher low than the early February downward surge to $68. The repeated defense of support, plus the improvement in ETF flows, indicates that an accumulation process may be underway.
Current key levels:
- Nearby support: $77.36 (lower Bollinger Band)
- Critical floor: $76.69-$76.00
- First resistance: $83.71 (intermediate moving average)
- Major resistance: $90.05-$94.00 (midpoint of Bollinger Band and Supertrend area)
On the 2-hour chart, the Ichimoku Cloud formed a resistance area in the $81-$82 range. This zone needs to be broken with volume support to confirm a reversal. Meanwhile, the RSI recovered from 44 to 62, signaling strengthening momentum, but has yet to enter the overbought area which usually indicates potential rally exhaustion.
Intraday Structure Indicates Bullish Divergence Starting to Form
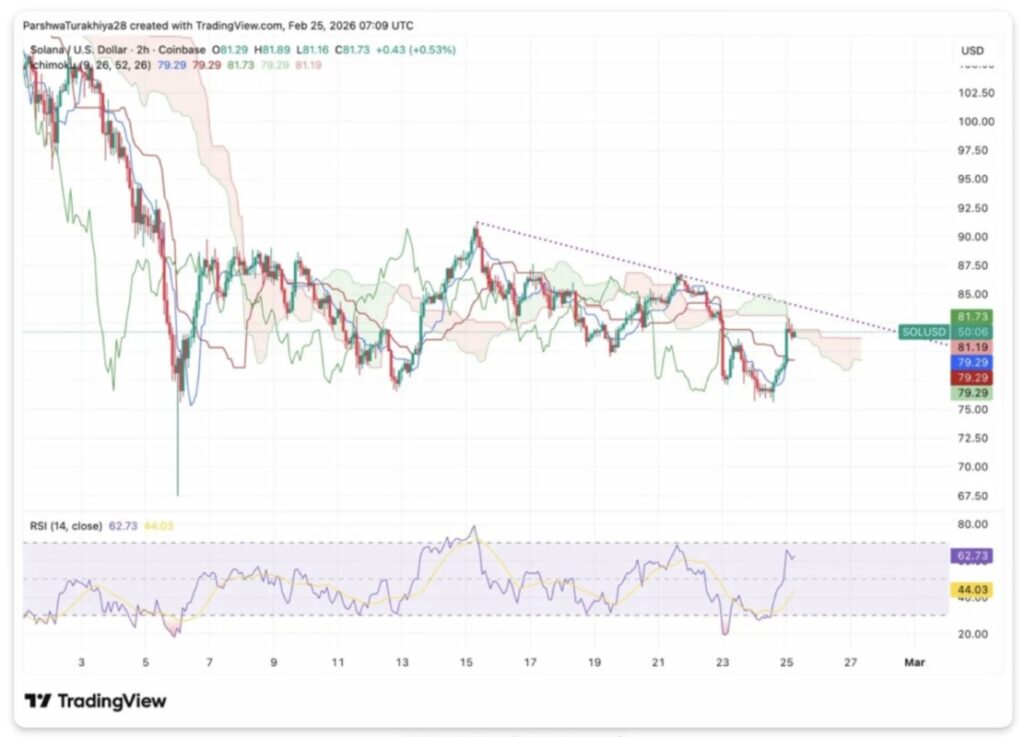
On the shorter timeframe, Solana is looking to break the descending trendline that capped its rally since mid-February. The Ichimoku Cloud on the 2-hour chart also moved from red to neutral conditions, suggesting the short-term bearish momentum is fading.
Indicators such as Chaikin Money Flow can provide additional confirmation, but the current price action already shows a change in behavior: buyers are starting to enter in the support area, instead of waiting for lower levels. This kind of pattern often appears ahead of a reversal, especially when it coincides with an improvement in institutional fund flows.
From a level perspective, the bullish side needs a price close above $83.71 to turn the immediate structure neutral. Thereafter, a break of $90.05 could potentially invalidate the bearish scenario and open up room for an increase towards $94.00, until a retest opportunity of the $100.$76 area reduces the short-term barriers and, in a technical context, could potentially ease the price push through the $80-$83 range.
Follow us on target="_blank" rel="noreferrer noopener" href="https://news.google.com/u/2/publications/CAAqBwgKMKXoywsw1YPjAw?hl=id&gl=ID&ceid=ID%3Aid">Google News to stay up to date with the latest in crypto and blockchain technology. Check Bitcoin price, usdt to idr and tokenized nvidia stock price through Pintu Market.
Enjoy an easy and secure crypto trading and crypto gold investment experience by downloading the Pintu crypto app via Play Store or App Store now. Also, experience web trading with advanced trading tools such as pro charting, various order types, and portfolio tracker only at Pintu Pro.
*Disclaimer
This content aims to enrich readers’ information. Pintu collects this information from various relevant sources and is not influenced by outside parties. Note that an asset’s past performance does not determine its projected future performance. Crypto trading activities are subject to high risk and volatility, always do your own research and use cold hard cash before investing. All activities of buying and selling Bitcoin and other crypto asset investments are the responsibility of the reader.
Reference:
- Coin Edition. Solana Price Prediction: $3.78M ETF Inflows Support Bounce Toward $90. Accessed on February 26, 2026
Berita Terbaru
© 2026 PT Pintu Kemana Saja. All Rights Reserved.
Kegiatan perdagangan aset crypto dilakukan oleh PT Pintu Kemana Saja, suatu perusahaan Pedagang Aset Keuangan Digital yang berizin dan diawasi oleh Otoritas Jasa Keuangan serta merupakan anggota PT Central Finansial X (CFX) dan PT Kliring Komoditi Indonesia (KKI). Kegiatan perdagangan aset crypto adalah kegiatan berisiko tinggi. PT Pintu Kemana Saja tidak memberikan rekomendasi apa pun mengenai investasi dan/atau produk aset crypto. Pengguna wajib mempelajari secara hati-hati setiap hal yang berkaitan dengan perdagangan aset crypto (termasuk risiko terkait) dan penggunaan aplikasi. Semua keputusan perdagangan aset crypto dan/atau kontrak berjangka atas aset crypto merupakan keputusan mandiri pengguna.