Download Pintu App
Pippin Price Prediction: PIPPIN May Be Setting Up for a 300% Breakout as Smart Money Steps In
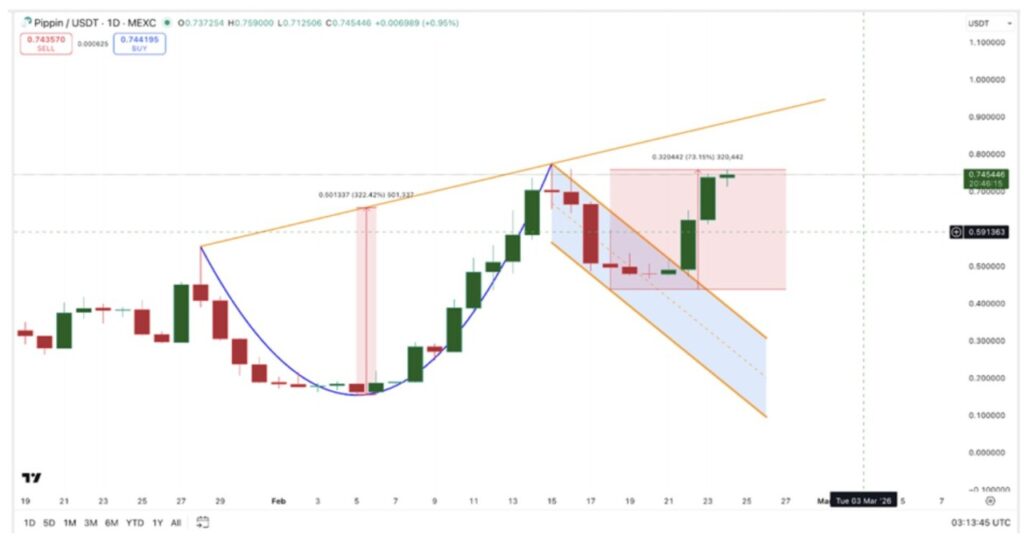
Jakarta, Pintu News – The price of Pippin (PIPPIN) surged 73% since February 18 and attracted widespread attention in the crypto market. This rise managed to break out of the cup and handle pattern that started forming since late January. Many traders think this rally may be nearing its end, but the data is showing different signals.
Open interest shot up by around 50%, while the funding rate actually declined. This combination was unusual. Selling pressure from the bourses also disappeared, and smart money indicators turned positive.
Technically, the cup and handle pattern indicates a potential upside of up to 300%; a target of $2 becomes reasonable if the neckline area is broken decisively and cleanly.
Cup and Handle Pattern Indicates Upside Potential of Around 300% While Funding Remains Low
Pippin started forming a “cup” structure on the chart as early as January 28. The rounded bottom was built up gradually and was only completed after a few weeks.
Read also: Ripple (XRP) Price Tests Key Support, Will Breakout to $1.5 Happen?
On February 22, the price broke out of the handle area, which is a consolidation phase that generally appears before big moves. In terms of technical analysis, this pattern has a measurable target calculated from the depth of the cup to the neckline. Based on this calculation, the projected upside is in the range of 300% from the current level.
What makes it interesting is its derivatives market dynamics. The open interest of the Pippin futures contract increased from $75.89 million on February 19 to $145.22 million on February 24, equivalent to a jump of about 50%. This indicates that more and more traders are opening positions.
Typically, the spike in open interest that occurs alongside a price rally is often associated with the use of excessive leverage. When leverage is too high, the risk is a liquidation cascade that can trigger a sharp reversal.
However, the funding rate gave a different signal. Funding peaked at 0.115% on February 19, just as the rally began. As prices continued to rise, the funding rate dropped to 0.004% on February 24.
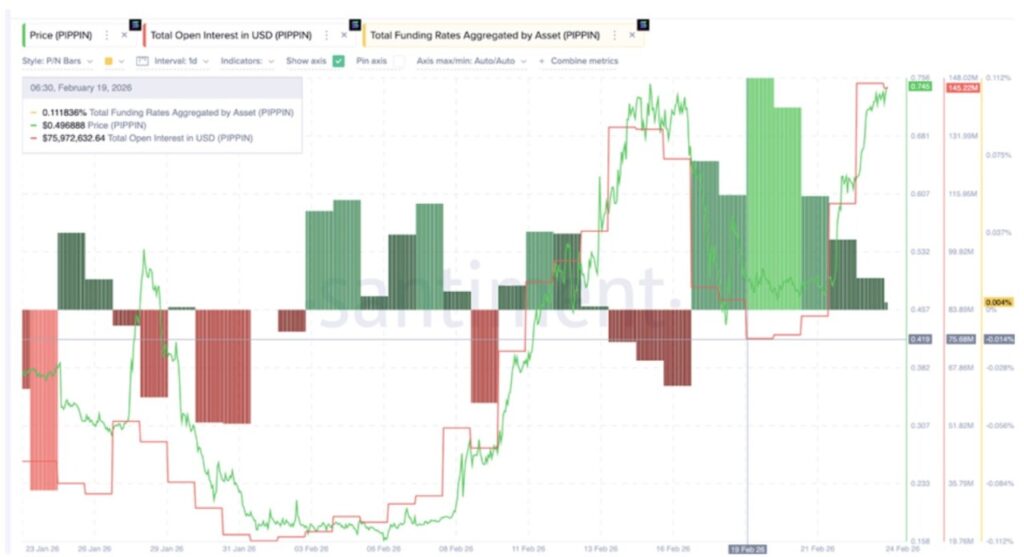
The funding rate reflects the cost that long positions pay to short positions to maintain open positions; high funding generally indicates an overly dense and leveraged long.
Conversely, low funding points to a rally that is not solely driven by aggressive speculation. The drop in funding on this meme coin, when the price and open interest are both increasing, suggests a more organic demand than just a leverage push.
Smart Money Starts Accumulating as Selling Pressure Drying Up
Data on exchange inflows can give an idea of who is predominantly buying or selling. On February 22, around 2.8 million Pippin tokens flowed into exchanges. This generally reflects heavy selling pressure, as assets moved to exchanges are often intended to be sold.
But on February 23, the inflow plummeted to only around 272k tokens, a drop of approximately 90% in one day, coinciding with the moment the price made a breakout.
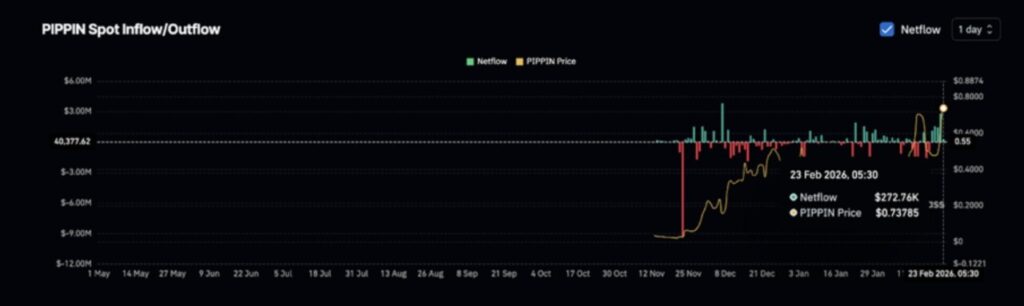
The timing aspect is important. In the breakout phase, sellers usually take advantage of the upside to exit into strength. When the selling pressure dissipates just as the price breaks the resistance, it indicates that the supply from the sellers has been depleted; there’s not much left for a big sell-off.
At the same time, the Chaikin Money Flow (CMF) indicator moved to break above the zero line. The CMF measures the inflow and outflow of funds by considering volume as well as price movements. Values above zero signify accumulation, while below zero leads to distribution.
Read also: Solana (SOL) ready to soar? $3.78M ETF inflow pushes price to $90!
The CMF turning positive during this rally reinforces the notion that large-capitalized players are starting to enter positions. In general, retail traders tend to chase the price after a breakout occurs, buying when the price has rallied.
In contrast, “smart money” typically accumulates before breakouts, when prices look sluggish and market interest is low. The combination of sharply shrinking stock inflows and a positive CMF points to the possibility that institutional buyers or whales have been gradually absorbing supply before the big move begins.
When retail attention starts to build, large players are expected to have already taken positions.
PIPPIN Price Projection: $0.92 Then $2.06
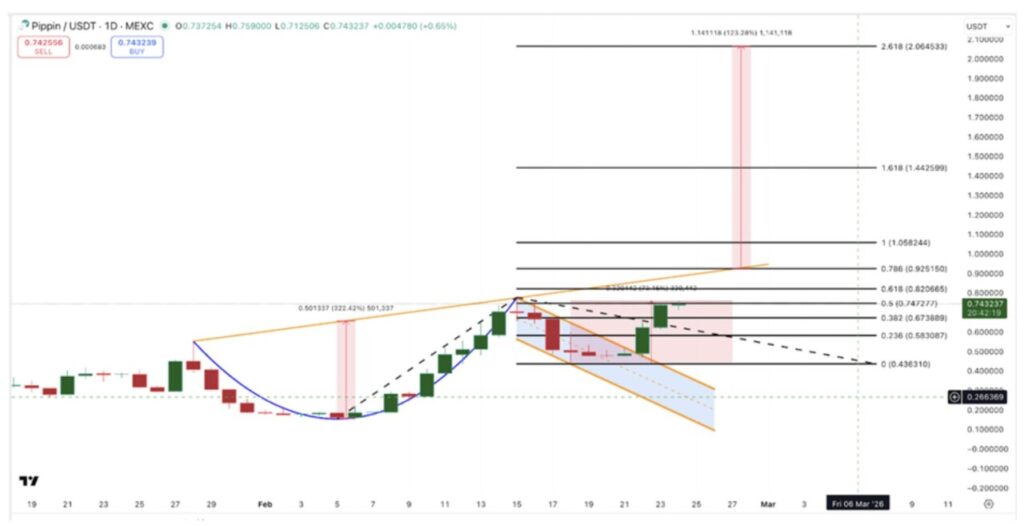
The cup and handle pattern has a price target that is generally calculated in a measured manner: the distance from the bottom of the cup to the neckline is measured, and then added to the breakout point.
For Pippin, the math points to the first major resistance area around $0.92. If $0.92 is successfully broken, the next upside path could potentially lead to $2.06. With the current price reference at around $0.73, an increase towards $2.06 would mean an additional rally of around 123%.
The full target of the pattern is above 300% of the breakout level. However, not all cup and handle patterns reach their target size; some fail halfway or stop halfway. However, the series of supporting evidence makes this setup seem stronger than the average technical pattern.
Funding remaining low suggests the rally is not supported by excessive leverage, so there is relatively less risk of “cleaning up” positions through mass liquidation. Selling pressure from exchanges that have dried up also opens up opportunities for supply shock. Meanwhile, accumulation signals through CMF suggest big players are potentially anticipating higher prices.
There are two main factors that could derail this scenario. First, if Bitcoin experiences a sharp decline, many altcoins tend to be dragged down regardless of their technical condition. Second, if open interest continues to rise but funding spikes again, it signals a rally turning into leverage-based speculation that usually ends in a series of liquidations.
For now, the metrics mentioned still favor a bullish argument for Pippin, with a target of $2 becoming quite realistic if the momentum continues and the technical pattern fully develops in the coming weeks.
Follow us on Google News to stay up to date with the latest in crypto and blockchain technology. Check Bitcoin price, usdt to idr and tokenized nvidia stock price through Pintu Market.
Enjoy an easy and secure crypto trading and crypto gold investment experience by downloading the Pintu crypto app via Play Store or App Store now. Also, experience web trading with advanced trading tools such as pro charting, various order types, and portfolio tracker only at Pintu Pro.
*Disclaimer
This content aims to enrich readers’ information. Pintu collects this information from various relevant sources and is not influenced by outside parties. Note that an asset’s past performance does not determine its projected future performance. Crypto trading activities are subject to high risk and volatility, always do your own research and use cold hard cash before investing. All activities of buying and selling Bitcoin and other crypto asset investments are the responsibility of the reader.
Reference:
- Coin Republic. Pippin Price Prediction Signals 300% Breakout as Smart Money Loads Up. Accessed on February 26, 2026
Berita Terbaru
© 2026 PT Pintu Kemana Saja. All Rights Reserved.
Kegiatan perdagangan aset crypto dilakukan oleh PT Pintu Kemana Saja, suatu perusahaan Pedagang Aset Keuangan Digital yang berizin dan diawasi oleh Otoritas Jasa Keuangan serta merupakan anggota PT Central Finansial X (CFX) dan PT Kliring Komoditi Indonesia (KKI). Kegiatan perdagangan aset crypto adalah kegiatan berisiko tinggi. PT Pintu Kemana Saja tidak memberikan rekomendasi apa pun mengenai investasi dan/atau produk aset crypto. Pengguna wajib mempelajari secara hati-hati setiap hal yang berkaitan dengan perdagangan aset crypto (termasuk risiko terkait) dan penggunaan aplikasi. Semua keputusan perdagangan aset crypto dan/atau kontrak berjangka atas aset crypto merupakan keputusan mandiri pengguna.