Download Pintu App
Bitcoin Surges to $72,000 Today as a Bullish Structure Begins to Build Momentum
Jakarta, Pintu News – Bitcoin (BTC) is approaching a crucial resistance area, as technical indicators and market flows indicate a potential breakout attempt. Traders are now closely monitoring momentum signals, while derivatives activity and inflows and outflows on exchanges are showing a change in the level of market participant participation.
Recent price movements suggest strengthening bullish pressure after Bitcoin formed a series of higher highs and higher lows since late February. As such, market participants’ attention is on whether buyers are able to maintain strength above the important support zone around $69,900.
Then, how will the Bitcoin price move today?
Bitcoin Price Rises 7.23% in 24 Hours
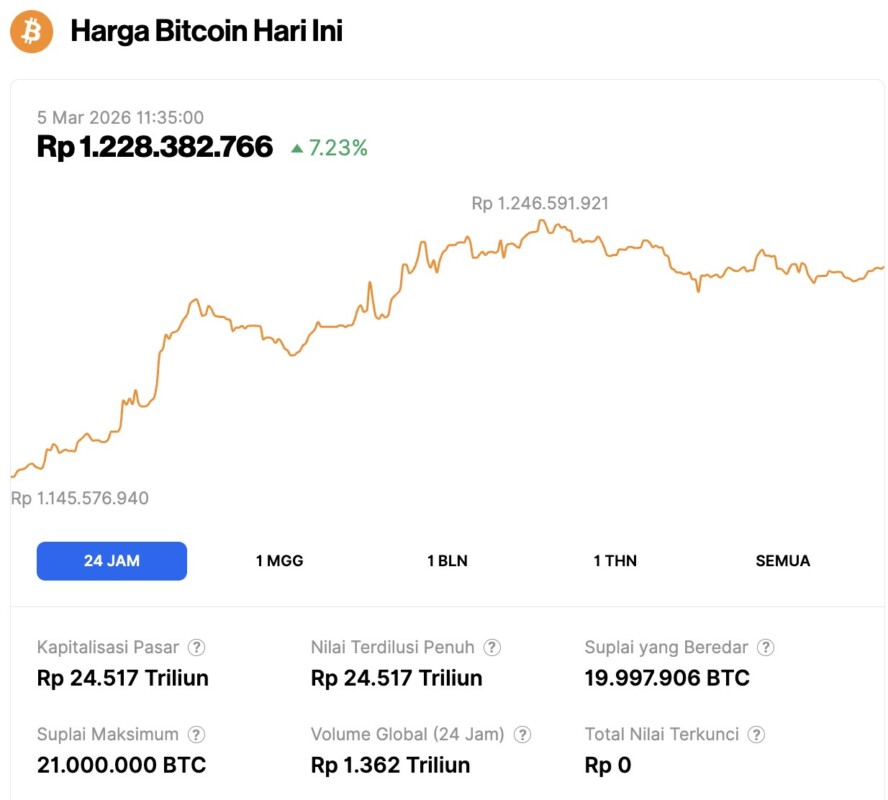
On March 5, 2026, Bitcoin was trading at $72.927, or approximately IDR 1,228,382,766, marking a 7.23% gain over the past 24 hours. Within the same period, BTC moved between a low of IDR 1,145,630,582 and a high of IDR 1,246,591,921.
At the time of writing, Bitcoin’s market capitalization is estimated at around IDR 24,517 trillion, while 24-hour trading volume has surged 46% to IDR 1,362 trillion.
Read also: Ethereum Price Surges 7% Today: Smart DCA Signals and ETH Patterns Drive Market Optimism!
Bullish Structure Builds Momentum
Bitcoin is currently trading above key Fibonacci retracement levels, which boosts the confidence of short-term traders. Price is also holding strong above the Ichimoku cloud, a structure that often supports more sustained upward momentum.
Also, the rising Tenkan and Kijun lines indicate that buyers are still in control of the short-term trend direction. The Average Directional Index is now around 23 and continues to move up, indicating that the trend strength is improving.
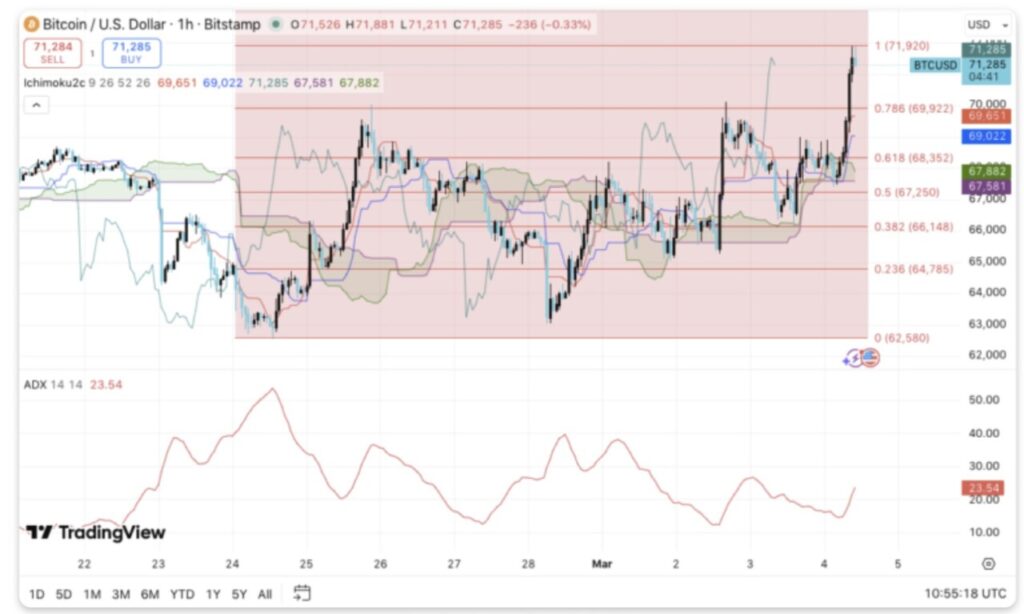
As such, a decisive move through the $71,920 resistance level could trigger a stronger upside momentum. Analysts expect the next liquidity zone to be around $73,000.
Furthermore, if the breakout continues, the upside could potentially extend towards a wider resistance area in the range of $75,000 to $76,000. These levels represent psychological and historical resistance zones, so selling pressure could increase.
However, Bitcoin still faces significant resistance near the latest swing high around $71,900. Sellers previously defended the area, giving rise to skepticism among aggressive breakout traders.
If another rejection occurs, the price could correct towards $69,900 which is the closest structural support area. Additionally, a deeper correction could potentially test $68,350 or even approach the $67,250 range.
These levels previously attracted buying interest during the previous consolidation phase. As such, traders often view these zones as buy-the-dip areas within the context of a broader uptrend. Conversely, a drop below these supports could weaken short-term momentum and temporarily shift market sentiment.
Derivative Activities and Exchange Flows Provide Context
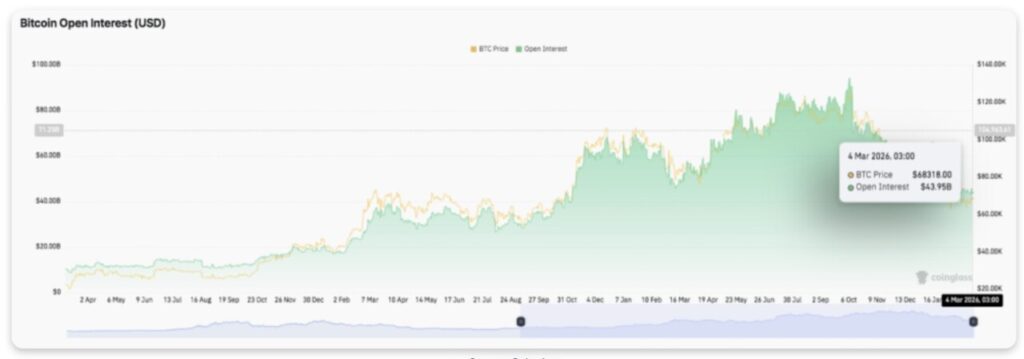
Beyond technical indicators, derivatives activity can give an idea of the level of market participation. Open interest increased sharply during the rally as traders added leveraged exposure.
Read also: Dogecoin Price Up 7% Today: DOGE Indicates Potential Bullish Expansion
The data shows an increase from under $20 billion to a peak near $90 billion. Periodic price corrections triggered liquidation, resulting in a temporary drop in open interest on some trading platforms.
Even so, the underlying trend still reflects the increasing involvement of capital in the Bitcoin market. The latest figures put open interest at around $44 billion as Bitcoin trades near $68,000.
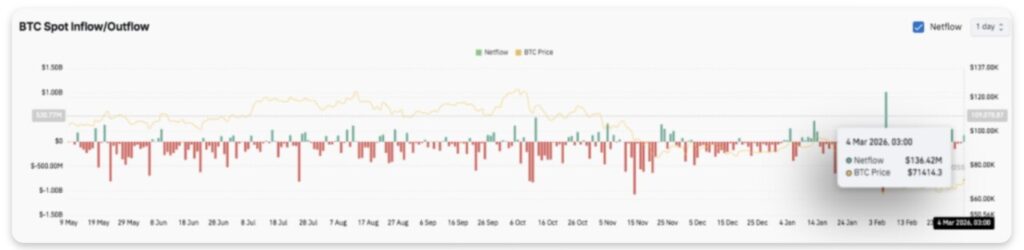
The exchange flow data also highlighted important changes in investor behavior. In previous months, outflows occurred consistently, indicating long-term holders were withdrawing coins from the exchange.
Technical Outlook of Bitcoin Price
Bitcoin’s key levels are now relatively clear, as the market seeks to sustain the recent recovery and breakout structure formed.
Upside level: $71,920 is the closest resistance, given that multiple rejections occurred in this area. A confirmed break above this level could push Bitcoin towards the $73,000-$74,000 liquidity zone. If the bullish momentum strengthens, the next targets are around $75,500 and $76,000.
Levels of decline: The immediate support is around $69,900, aligned with 0.786 Fibonacci retracement and the latest breakout area. Below that, stronger support comes in at $68,350 (Fibonacci 0.618), followed by $67,250 which is around the middle retracement. A deeper correction could open up space towards $66,148 as well as a broader structural support area in the range of $64,785 to $62,580.
Resistance limit: $71,920 remains a major barrier that needs to be turned into support to confirm stronger short-term bullish momentum. If this level is successfully broken and maintained, further movement could occur, supported by increased derivatives activity and improved market participation.
Technically, Bitcoin is trading above the Ichimoku cloud, which signals a favorable bullish structure. In addition, the Tenkan and Kijun lines are still moving up, indicating control remains on the buyers’ side.
The momentum indicator also improved as the ADX increased gradually towards the stronger trend area. This configuration suggests the market could potentially transition from a consolidation phase towards a more directional move.
Follow us on target="_blank" rel="noreferrer noopener" href="https://news.google.com/u/2/publications/CAAqBwgKMKXoywsw1YPjAw?hl=id&gl=ID&ceid=ID%3Aid">Google News to stay up to date with the latest in crypto and blockchain technology. Check Bitcoin price, usdt to idr and tokenized nvidia stock price through Pintu Market.
Enjoy an easy and secure crypto trading and crypto gold investment experience by downloading the Pintu crypto app via Play Store or App Store now. Also, experience web trading with advanced trading tools such as pro charting, various order types, and portfolio tracker only at Pintu Pro.
*Disclaimer
This content aims to enrich readers’ information. Pintu collects this information from various relevant sources and is not influenced by outside parties. Note that an asset’s past performance does not determine its projected future performance. Crypto trading activities are subject to high risk and volatility, always do your own research and use cold hard cash before investing. All activities of buying and selling Bitcoin and other crypto asset investments are the responsibility of the reader.
Reference:
- CoinEdition. Bitcoin Price Prediction: BTC Market Signals Point to Potential Rally Toward $75K. Accessed on March 5, 2026
Berita Terbaru
© 2026 PT Pintu Kemana Saja. All Rights Reserved.
Kegiatan perdagangan aset crypto dilakukan oleh PT Pintu Kemana Saja, suatu perusahaan Pedagang Aset Keuangan Digital yang berizin dan diawasi oleh Otoritas Jasa Keuangan serta merupakan anggota PT Central Finansial X (CFX) dan PT Kliring Komoditi Indonesia (KKI). Kegiatan perdagangan aset crypto adalah kegiatan berisiko tinggi. PT Pintu Kemana Saja tidak memberikan rekomendasi apa pun mengenai investasi dan/atau produk aset crypto. Pengguna wajib mempelajari secara hati-hati setiap hal yang berkaitan dengan perdagangan aset crypto (termasuk risiko terkait) dan penggunaan aplikasi. Semua keputusan perdagangan aset crypto dan/atau kontrak berjangka atas aset crypto merupakan keputusan mandiri pengguna.