Download Pintu App
Bitcoin Pushes Back Toward $70,000 Today as Michael Saylor Doubles Down on Aggressive BTC Accumulation
Jakarta, Pintu News – The price of Bitcoin (BTC) has again signaled that some market participants do not really care about short-term fluctuations. They continue to accumulate with high intensity.
The spotlight this time is on Strategy, which at a crucial phase confirmed the purchase of 17,994 BTC for approximately $1.28 billion and an average price of $70,946 per BTC. The transaction increased the company’s total holdings to 738,731 BTC, which it claimed was acquired at a total cost of approximately $56.04 billion at an average price of $75,862 per BTC as of March 8, 2026.
As a company that has been hoarding BTC for years, its approach has remained consistent: buy and hold.
Bitcoin Price Up 4.16% in 24 Hours
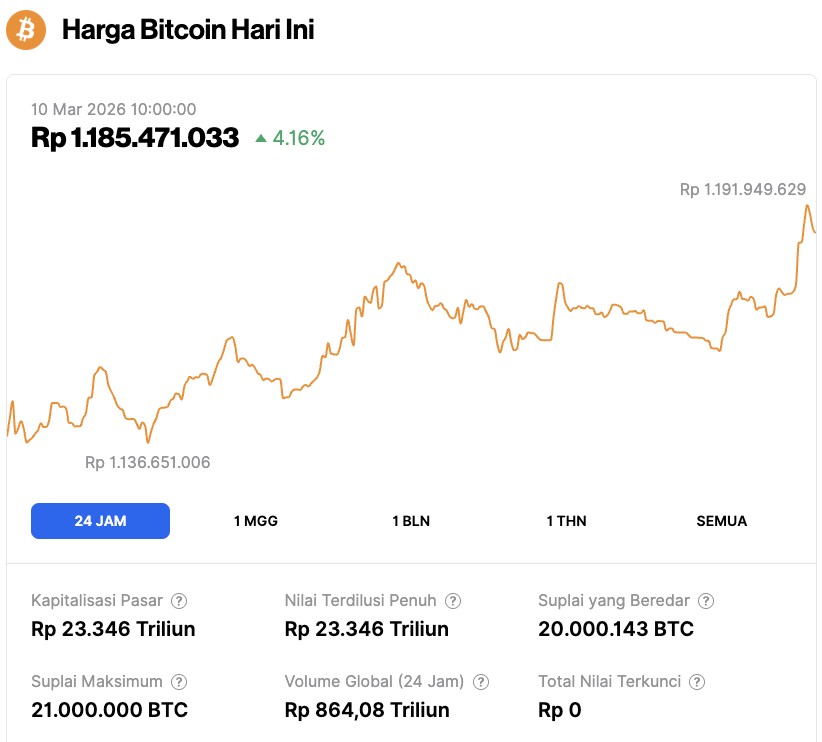
On March 10, 2026, Bitcoin was trading at $70,064, or roughly IDR 1,185,471,033, marking a 4.16% gain over the past 24 hours. Within that window, BTC dipped to a low of IDR 1,136,651,006 before climbing to a high of IDR 1,191,949,629.
At the time of writing, Bitcoin’s market capitalization is estimated at around IDR 23,346 trillion, while 24-hour trading volume has surged 37% to IDR 864.08 trillion.
Read also: Shiba Inu Launches ShibClaw AI Skill: A Sophisticated Innovation Amidst Crypto Security Threats?
Strategy More Aggressive in Accumulating Bitcoin
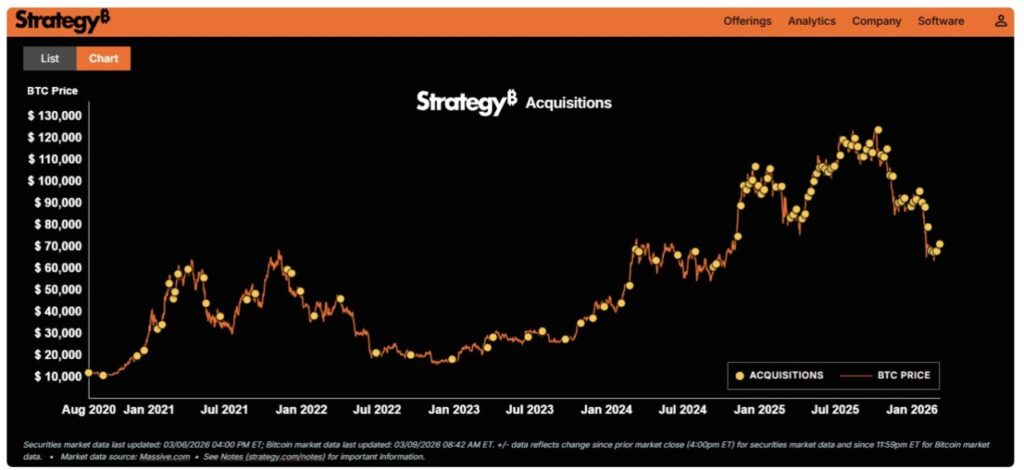
Corporate accumulation is nothing new for Strategy. However, this latest purchase stands out for one key factor: the momentum of its execution. The company added to its BTC holdings when the market was in the $70,000 range, reinforcing the pattern that institutional buyers seem comfortable accumulating at these levels.
When large entities repeatedly absorb supply at relatively similar prices, market participants usually pay special attention. This kind of behavior tends to shape long-term market structures, rather than simply fueling short-term speculation.
Ultimately, this dynamic also prolongs the endless debate over Bitcoin price predictions. Because when billions of funds flow into an asset during a consolidation phase, it’s natural to ask: what’s next.
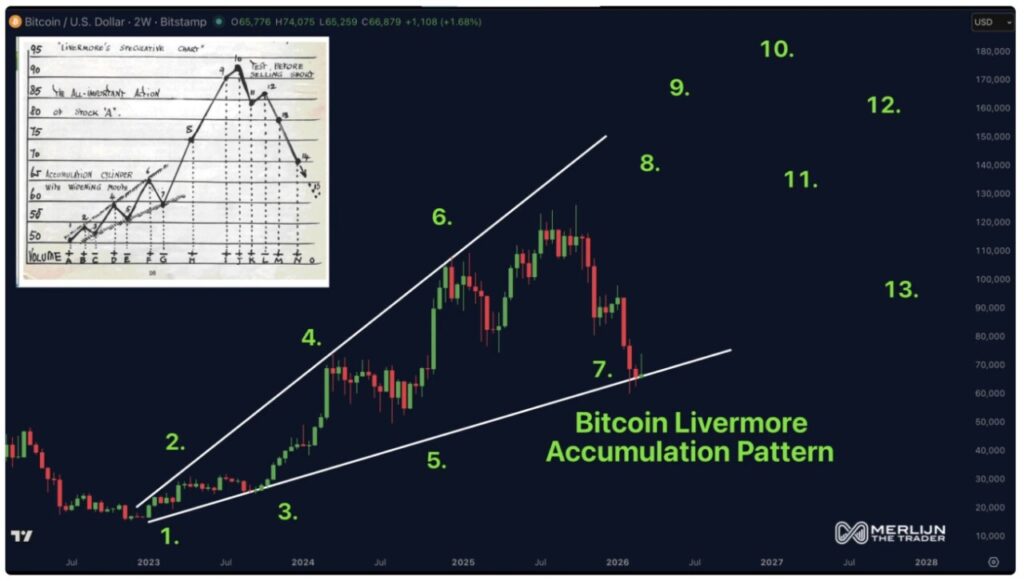
Old Patterns Reflected in Bitcoin Price Chart
At this point, some market observers think Bitcoin’s price chart is following a surprisingly old “roadmap” – a concept that is said to have been outlined almost a century ago.
The structure of its movement is attributed to a trading pattern identified in the 1920s by Jesse Livermore, one of the most recognized trader figures of the early era of financial markets, and is considered to be recognized by large short players.
According to the interpretations circulating in the traders’ community, the market appears to move in the order of the pattern gradually. The key level is simple. Above $70,000, the next upside phase is considered confirmed. Below $60,000, the market could potentially just extend the accumulation phase.
Read also: Gold Price Prediction Ahead of FOMC Meeting on March 18, 2026, Good Time to Buy Gold?
The $70,000 level is the main focus of the market
So, where does the market currently stand? Right in the high-voltage area. The Bitcoin/USD range between $60,000 and $70,000 is practically the deciding arena: whether the cycle goes faster, or stays flat for longer.
Institutional accumulation near the upper limit of this range adds ammunition to the bullish argument. However, markets rarely move in a straight line, especially when sentiment easily swings between pessimism and optimism.
However, the big narrative is hard to ignore. Companies with holdings of over 738,000 BTC just added coins worth approximately $1.28 billion. If historical patterns do continue, the direction of Bitcoin’s next price move could very well be determined by the market’s ability to maintain the critical $70,000 threshold.
Follow us on target="_blank" rel="noreferrer noopener" href="https://news.google.com/u/2/publications/CAAqBwgKMKXoywsw1YPjAw?hl=id&gl=ID&ceid=ID%3Aid">Google News to stay up to date with the latest in crypto and blockchain technology. Check Bitcoin price, usdt to idr and tokenized nvidia stock price through Pintu Market.
Enjoy an easy and secure crypto trading and crypto gold investment experience by downloading the Pintu crypto app via Play Store or App Store now. Also, experience web trading with advanced trading tools such as pro charting, various order types, and portfolio tracker only at Pintu Pro.
*Disclaimer
This content aims to enrich readers’ information. Pintu collects this information from various relevant sources and is not influenced by outside parties. Note that an asset’s past performance does not determine its projected future performance. Crypto trading activities are subject to high risk and volatility, always do your own research and use cold hard cash before investing. All activities of buying and selling Bitcoin and other crypto asset investments are the responsibility of the reader.
Reference:
- Coinpedia. Bitcoin Price Holds Key Levels as Strategy Buys $1.28B BTC and Century-Old Pattern Resurfaces. Accessed on March 10, 2026
Berita Terbaru
© 2026 PT Pintu Kemana Saja. All Rights Reserved.
Kegiatan perdagangan aset crypto dilakukan oleh PT Pintu Kemana Saja, suatu perusahaan Pedagang Aset Keuangan Digital yang berizin dan diawasi oleh Otoritas Jasa Keuangan serta merupakan anggota PT Central Finansial X (CFX) dan PT Kliring Komoditi Indonesia (KKI). Kegiatan perdagangan aset crypto adalah kegiatan berisiko tinggi. PT Pintu Kemana Saja tidak memberikan rekomendasi apa pun mengenai investasi dan/atau produk aset crypto. Pengguna wajib mempelajari secara hati-hati setiap hal yang berkaitan dengan perdagangan aset crypto (termasuk risiko terkait) dan penggunaan aplikasi. Semua keputusan perdagangan aset crypto dan/atau kontrak berjangka atas aset crypto merupakan keputusan mandiri pengguna.