Download Pintu App
Ethereum Surges 6% Today as Analysts Assess Where ETH Could Move Next
Jakarta, Pintu News – Ethereum (ETH) remains stuck below key resistance zones, while support levels continue to be tested. The two most recent charts both show a similar message: market conditions still look fragile, and the next breakout or breakdown move has the potential to determine the next direction of movement.
Then, how will Ethereum price move today?
Ethereum Price Up 6.52% in 24 Hours
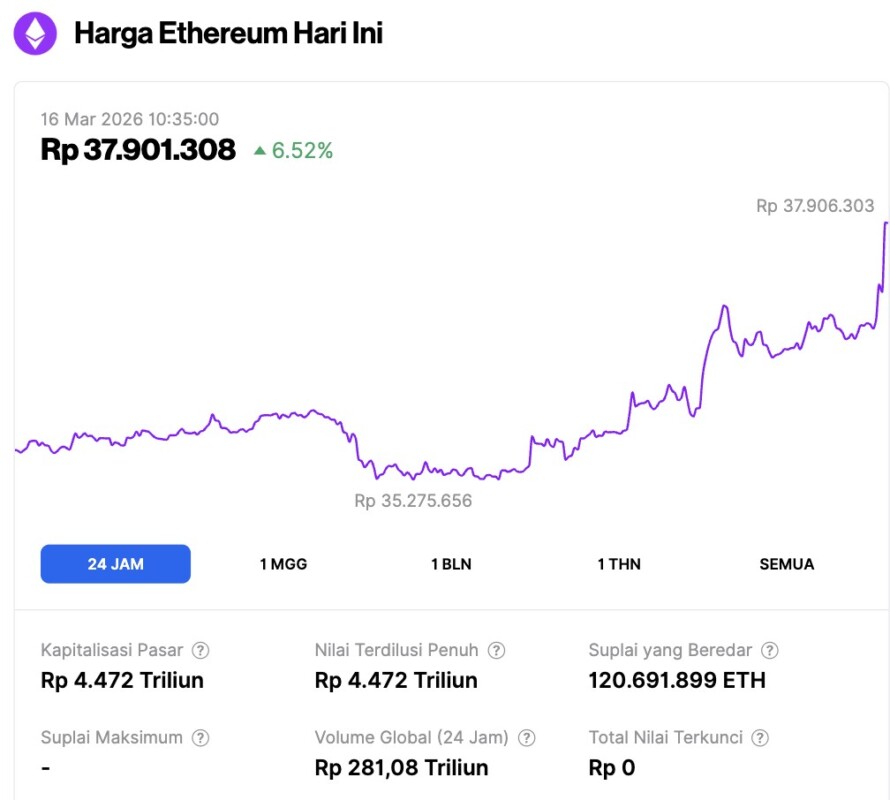
On March 16, 2026, Ethereum traded at around $2,235, or approximately IDR 37,901,308, after gaining 6.52% over the past 24 hours. During that period, ETH fell to an intraday low of IDR 35,275,656 before rising to a high of IDR 37,906,303.
At the time of writing, Ethereum’s market capitalization stood at roughly IDR 4,472 trillion, while its daily trading volume jumped 85% to IDR 281.08 trillion over the same 24-hour period.
Read also: Bitcoin Price Rises to $73,000 Today: What’s Next for BTC?
Ethereum faces resistance at $2.1K, while $1.8K is still the support
Ethereum is still unable to break the $2,100 level. The daily chart from Daan Crypto Trades shows that selling pressure continues to emerge every time the price touches the area. As a result, Ethereum remains moving below the key resistance zone, instead of continuing a stronger recovery.
The chart highlights a supply area in the range of $2,106 to $2,166. Ethereum briefly re-entered that zone, but was unable to hold on. Sellers responded quickly, so the $2.1K area remains a major obstacle in the short term.
On the other hand, the $1.808 level remains a key support. Previous buyers managed to defend the area during the correction, and Daan considers the $1.8K zone more broadly as a level that the bullish side must guard. If Ethereum drops through this area, the market structure could weaken and open up opportunities for a deeper decline.
For now, Ethereum is still trading within a clear range. Resistance is around $2.1K, while support lies around $1.8K. A daily close above the resistance zone would signal stronger momentum. Until that happens, Ethereum is still moving between the supply pressure above and the support area below.
Read also: 3 Altcoins that Crypto Whales Are Buying and Selling Ahead of the March 2026 US CPI Release
Ethereum’s Bear Flag Structure Signals Breakdown Risk
Ethereum is still moving in a consolidation pattern that resembles a bear flag on the daily chart shared by Hardy. This structure was formed after a sharp decline at the beginning of the year, when Ethereum slid rapidly from higher levels before then entering into a sideways movement phase.
The chart shows the price moving narrower and narrower between the ascending trend lines, but remains below the major resistance zone around $2,127. Upward channel patterns like this often appear as a pause in the middle of a larger downtrend. As such, this structure has the potential to be a trend continuation pattern, rather than a reversal signal.
At the same time, several attempts to break the upper border of the channel continued to fail. Any move near the resistance area always results in a rejection wick, which indicates that selling pressure is still active around that level.
Meanwhile, the lower limit of the structure is close to the support zone marked around $1,937. This level has withstood several corrections since the consolidation phase began. As long as Ethereum stays within this channel, the price is likely to continue moving between these two boundaries.
However, Hardy thinks that the longer the market stays inside the bear flag pattern, the greater the potential breakdown that can occur. Longer consolidations allow liquidity to accumulate on both sides of the range. When this structure is finally broken, prices often move quickly towards the next support zone.
Below the current structure, the chart marks a larger weekly support area around $1,587. The area becomes the next important zone, as it was previously the entry point for buyers in the previous market phase.
For now, Ethereum is still in a narrowing range below resistance. This pattern still reflects a bearish market structure until the price is able to break out of the bear flag area and hold at higher levels.
Follow us on target="_blank" rel="noreferrer noopener" href="https://news.google.com/u/2/publications/CAAqBwgKMKXoywsw1YPjAw?hl=id&gl=ID&ceid=ID%3Aid">Google News to stay up to date with the latest in crypto and blockchain technology. Check Bitcoin price, usdt to idr and tokenized nvidia stock price via Pintu Market.
Enjoy an easy and secure crypto trading and crypto gold investment experience by downloading the Pintu crypto app via Play Store or App Store now. Also, experience web trading with advanced trading tools such as pro charting, various order types, and portfolio tracker only at Pintu Pro.
*Disclaimer
This content aims to enrich readers’ information. Pintu collects this information from various relevant sources and is not influenced by outside parties. Note that an asset’s past performance does not determine its projected future performance. Crypto trading activities are subject to high risk and volatility, always do your own research and use cold hard cash before investing. All activities of buying and selling Bitcoin and other crypto asset investments are the responsibility of the reader.
Reference:
- Coinpaper. Ethereum Price Prediction: $2.1K Resistance and Bear Flag Hint at Bigger Move. Accessed on March 16, 2026
Berita Terbaru
© 2026 PT Pintu Kemana Saja. All Rights Reserved.
Kegiatan perdagangan aset crypto dilakukan oleh PT Pintu Kemana Saja, suatu perusahaan Pedagang Aset Keuangan Digital yang berizin dan diawasi oleh Otoritas Jasa Keuangan serta merupakan anggota PT Central Finansial X (CFX) dan PT Kliring Komoditi Indonesia (KKI). Kegiatan perdagangan aset crypto adalah kegiatan berisiko tinggi. PT Pintu Kemana Saja tidak memberikan rekomendasi apa pun mengenai investasi dan/atau produk aset crypto. Pengguna wajib mempelajari secara hati-hati setiap hal yang berkaitan dengan perdagangan aset crypto (termasuk risiko terkait) dan penggunaan aplikasi. Semua keputusan perdagangan aset crypto dan/atau kontrak berjangka atas aset crypto merupakan keputusan mandiri pengguna.