Download Pintu App
Bitcoin Climbs to $69,000 Today: Can BTC Push Even Higher in April?
Jakarta, Pintu News – Bitcoin (BTC) is currently displaying two very different chart signals simultaneously. One pattern indicates that further downside movement could be imminent, while the larger monthly structure suggests that the market may already be approaching a broader bottom area.
Then, how is the current Bitcoin price movement?
Bitcoin Price Rises 2.82% in 24 Hours
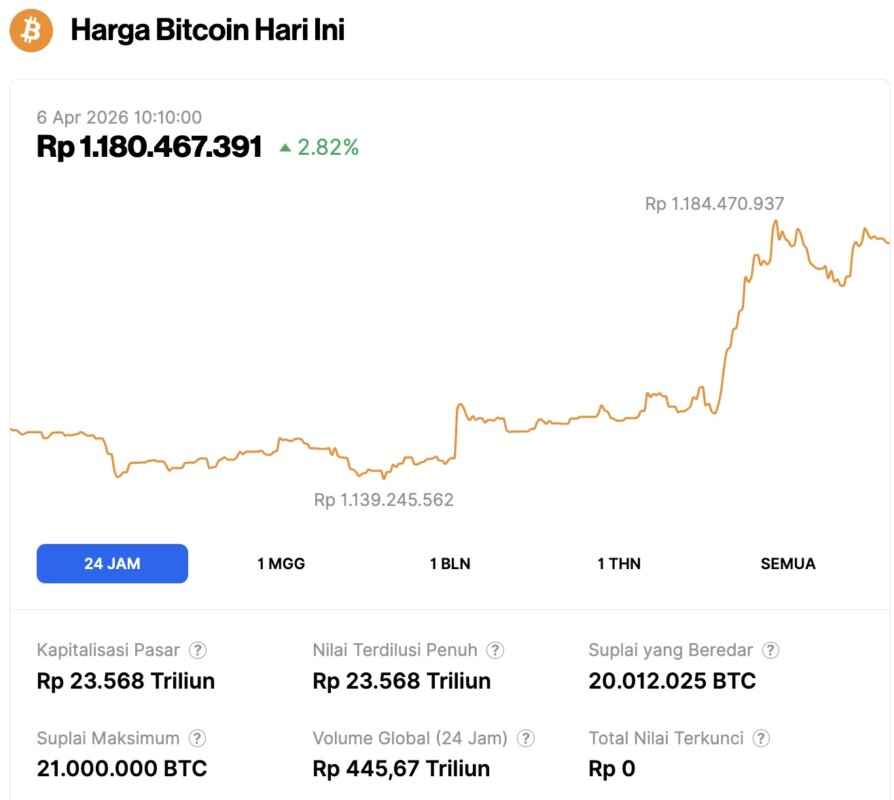
On April 6, 2026, Bitcoin was trading at $69,103, or around IDR 1,180,467,391, after gaining 2.82% over the past 24 hours. During that period, BTC fell to a low of IDR 1,139,245,562 before rising to a high of IDR 1,184,470,937.
At the time of writing, Bitcoin’s market capitalization stood at approximately IDR 23,568 trillion, while its 24-hour trading volume surged 70% to IDR 445.67 trillion.
Read also: 3 Key Factors Begin to Align, Altcoin Recovery Potential Opens Wide?
Bitcoin Chart Indicates Mid-April Risk as 68-Day Sideways Pattern Repeats itself
The chart Ted shared compares Bitcoin’s current structure with the previous pattern that ended in a sharp decline after a long sideways phase. In both periods, the price briefly moved above an ascending support line, then consolidated within a certain range for 68 days before finally experiencing strong downward pressure.
Based on the similarities, the post considers that Bitcoin could potentially face another breakdown in mid-April if the same pattern repeats itself.
This idea rests more on the similarity of time durations than simply price levels. The first structure on the left side shows Bitcoin moving sideways for 68 days before breaking down. Meanwhile, the second structure on the right shows another 68-day phase that this time ended around mid-April. In other words, the chart places time symmetry as the main signal.
The ascending trendline is also an important element as the price is now back near the ascending support area during the consolidation phase. In the previous example, the support failed to hold when selling pressure increased. Therefore, the current structure raises concerns that a similar breakdown could occur again if buyers are unable to sustain the same pattern.
However, this chart doesn’t confirm that a sell-off will definitely occur. Similar timeframes can still produce different results, and repeated patterns don’t always lead to the same scenario. Therefore, this comparison is best viewed as a warning signal rather than definitive proof that prices will fall.
The gray areas on either side of the chart seem to represent the previous consolidation zone as well as a possible downward path should weakness reappear. This makes the main message clear: Bitcoin is still in a sideways phase, but the chart shows that pause patterns like this have ended badly before.
The main takeaway is that Ted sees a potential repeat of Bitcoin’s previous bearish structure, with mid-April considered the next window of risk. However, this bearish scenario remains dependent on whether the current price range actually breaks down like previous patterns.
Read also: 3 Crypto Made in USA that Stand Out and Grab Investors’ Attention in April 2026
Bitcoin Alligator Signal Indicates Cycle Bottom May Be Near
The chart shared by Titan of Crypto uses the Alligator indicator on a monthly time frame to compare Bitcoin’s current structure with previous market cycles. The main point is that in previous cycles, the green line cutting below the red line often appeared near the main bottom area.
As the same type of crossover is now being seen again, the post suggests that Bitcoin may already be at or at least near a cyclical low.
This pattern is considered important because the chart highlights several previous periods when the crossover appeared shortly before or around the bottom formation phase. In each of these cases, Bitcoin then moved towards a broader recovery. As such, this comparison is based more on the similarity of historical timing rather than short-term price movements.
The “bottom area” label on the chart also indicates that the crossover doesn’t always mark the absolute lowest candle. Instead, the signal often appears around a wider zone, which is the area where the market is forming a bottom. In other words, this signal is more about identifying the bottom region rather than one very precise turning point.
Even so, one indicator alone is not enough to confirm that a bottom has actually formed. Monthly signals are useful for reading the structure of the larger cycle, but they do not eliminate the possibility of continued volatility or additional retests.
Therefore, this chart supports the idea of a potential bottom area rather than the certainty that a full trend reversal has been confirmed.
The main message is quite clear: Bitcoin’s current monthly Alligator crossover looks similar to the signals that appeared near the low of the previous cycle. If the historical pattern holds true again, the market is likely already in or very close to the bottom formation phase, not at the beginning of a new major decline.
Follow us on Google News to stay up to date with the latest in crypto and blockchain technology. Check Bitcoin price, usdt to idr and tokenized nvidia stock price through Pintu Market.
As a safe crypto app, Pintu provides a crypto trading experience to access crypto gold investment easily and conveniently. You can also see today’ s gold jewelry price and today’s gold bullion price to support your investment activities and portfolio diversification as well as learn crypto through Pintu Academy.
Download the Pintu crypto app via Play Store or App Store now. Enjoy the web trading experience with various advanced trading tools such as pro charting, various types of order types, and portfolio tracker only at Pintu Pro.
*Disclaimer
This content aims to enrich readers’ information. Pintu collects this information from various relevant sources and is not influenced by outside parties. Note that an asset’s past performance does not determine its projected future performance. Crypto trading activities are subject to high risk and volatility, always do your own research and use cold hard cash before investing. All activities of buying and selling Bitcoin and other crypto asset investments are the responsibility of the reader.
Reference:
- Coinpaper. Bitcoin Price Prediction Amid Mid April Breakdown Risk. Accessed on April 6, 2026
Berita Terbaru
© 2026 PT Pintu Kemana Saja. All Rights Reserved.
Kegiatan perdagangan aset crypto dilakukan oleh PT Pintu Kemana Saja, suatu perusahaan Pedagang Aset Keuangan Digital yang berizin dan diawasi oleh Otoritas Jasa Keuangan serta merupakan anggota PT Central Finansial X (CFX) dan PT Kliring Komoditi Indonesia (KKI). Kegiatan perdagangan aset crypto adalah kegiatan berisiko tinggi. PT Pintu Kemana Saja tidak memberikan rekomendasi apa pun mengenai investasi dan/atau produk aset crypto. Pengguna wajib mempelajari secara hati-hati setiap hal yang berkaitan dengan perdagangan aset crypto (termasuk risiko terkait) dan penggunaan aplikasi. Semua keputusan perdagangan aset crypto dan/atau kontrak berjangka atas aset crypto merupakan keputusan mandiri pengguna.