Download Pintu App
Bitcoin Falls to $68,000 Today: After Three Bullish Signals, Why Is BTC Still Stuck?
Jakarta, Pintu News – Bitcoin (BTC) price stood at $69,192 on April 6 after bouncing about 4% from the local low recorded on April 5. This bounce was the third in a week that came from the same technical signal on the 8-hour chart.
On each occurrence, the signal always pushes the price movement upwards. However, each rally has also been held back at the same area of resistance. This pattern raises questions that can be answered through on-chain data, and the answers will determine whether this attempt ends differently or if it follows the previous two attempts as another failed breakout.
Then, how is the current Bitcoin price movement?
Bitcoin Price Drops 0.21% in 24 Hours
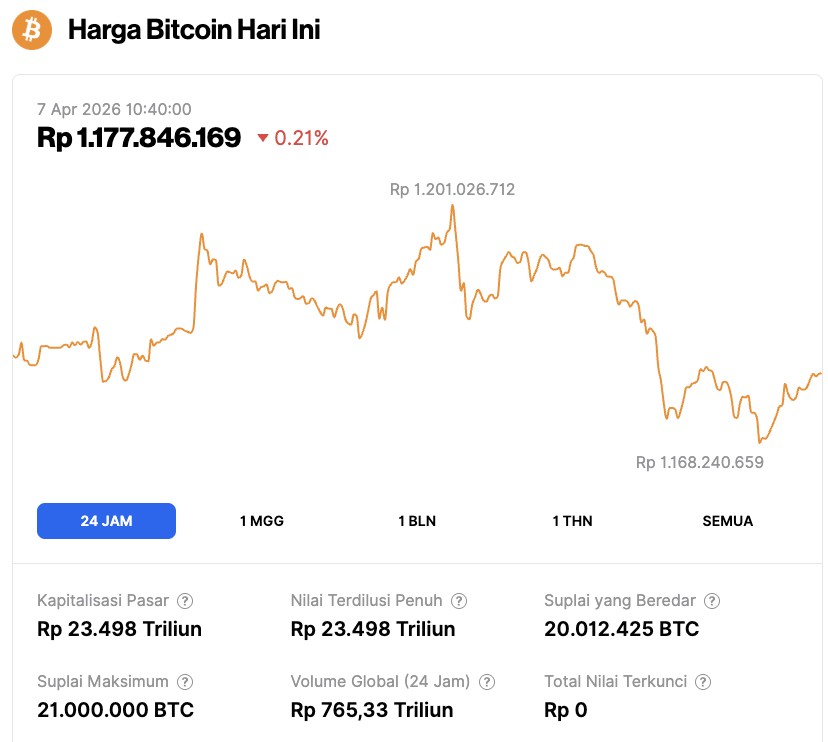
As of April 7, 2026, Bitcoin was trading at $68,760, or around IDR 1,177,846,169, after posting a 0.21% decline over the past 24 hours. During that period, BTC fell to an intraday low of IDR 1,168,240,659 before climbing to a high of IDR 1,201,026,712.
At the time of writing, Bitcoin’s market capitalization stood at approximately IDR 23,498 trillion, while its 24-hour trading volume jumped 31% to IDR 765.33 trillion.
Read also: Altcoin Season Index Touches Level 32 Today, Can Altcoin Beat Bitcoin in 2026?
Three Signals, Upper Limit Still the Same
Bitcoin price continues to form a series of short-term standard bullish divergences on the 8-hour chart (6/4). The Relative Strength Index (RSI), a momentum indicator that measures the speed and direction of price changes, recorded higher lows on each occasion, while the price formed lower lows. This pattern generally indicates weakening selling pressure and is often an early signal of a reversal.
The first divergence was completed on March 31, with the starting point on February 3. After that, Bitcoin briefly rallied 4.83% before its movement was arrested. The second divergence was completed on April 3 and only resulted in a 1.47% gain, making it the weakest of the three.
The third divergence completed on April 5 and has so far driven a rally of 4.24%, bringing the price back near $69,192.
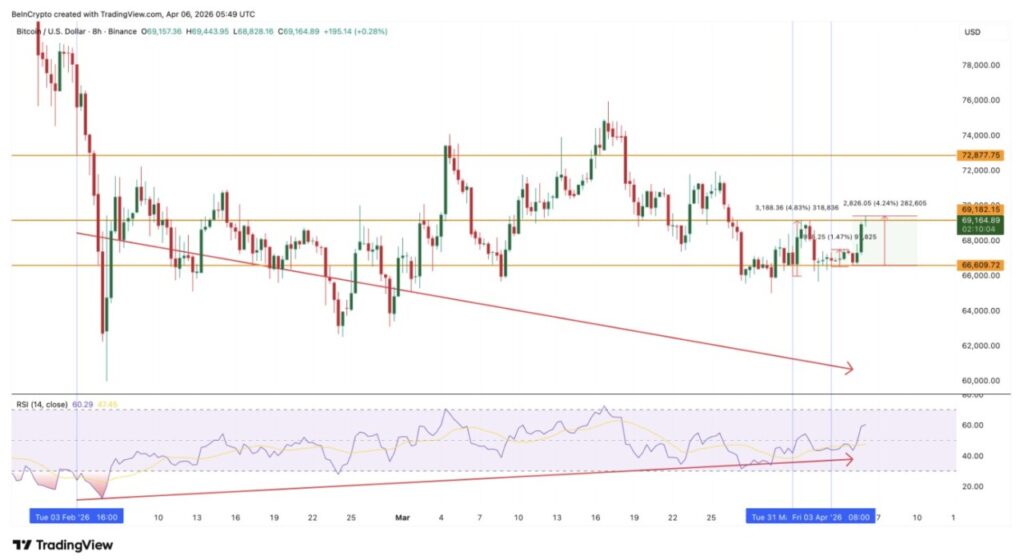
All three rallies have one thing in common. None of them were able to close convincingly above the $69,182 level on the 8-hour chart, which is the area where one of the previous bounces started to lose steam. The signals continue to appear, but that upper limit also continues to hold.
As of April 6, Bitcoin price is slightly above that level and is testing whether the third attempt has enough momentum to break out of the area that the previous two attempts failed to pass. The answer lies not only in the chart patterns, but also in who is buying and who is selling behind the market movements.
Two Pillars of On-Chain Confidence Begin to Weaken
The reason why the divergence has not been able to turn into a sustained rally is clear from the two on-chain data.
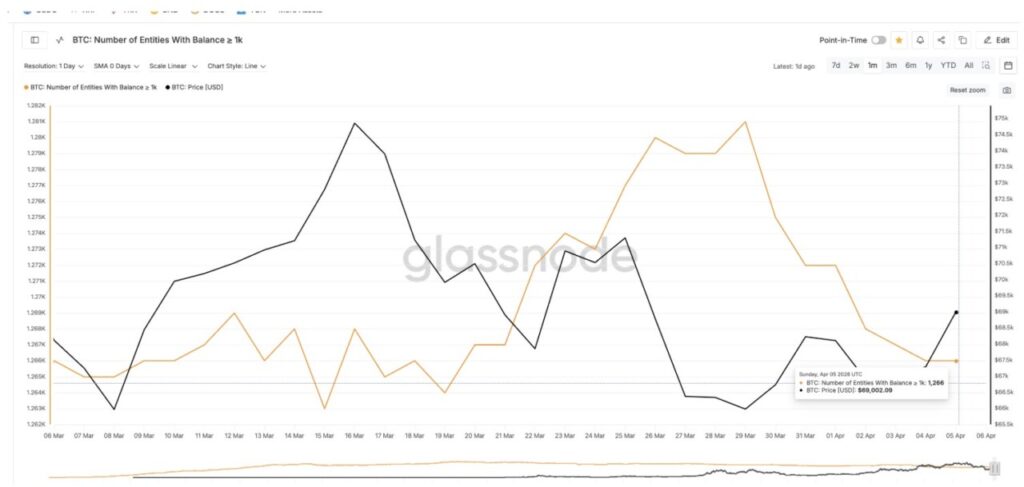
The first is whale concentration. The number of entities holding 1,000 BTC or more, which is often used as an indicator to gauge the largest holders in the market, peaked at 1,281 in mid-March. However, since then the number has steadily declined to 1,266 as of April 5. The decline of 15 whale-category wallets in three weeks suggests that the concentrated buying power that usually drives breakouts is waning, not growing.
This decline moved even faster after March 29, coinciding with the period when the three divergences began to form.
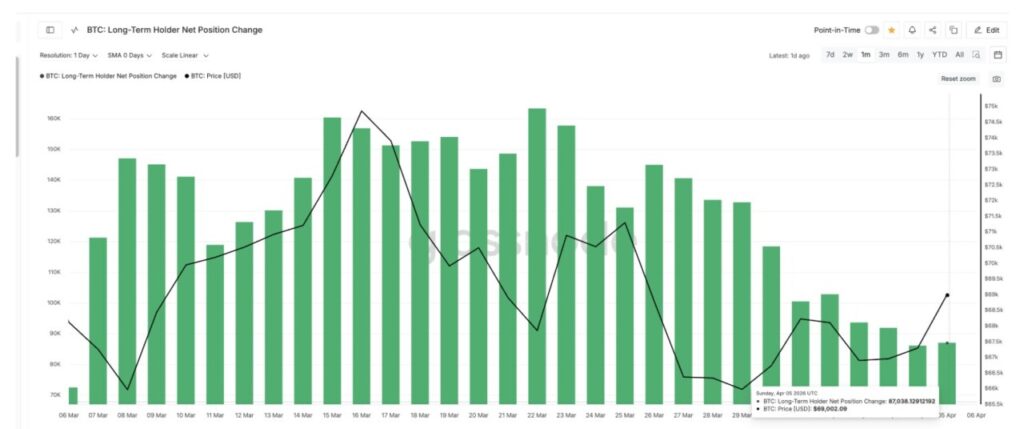
The second factor is the behavior of long-term holders. The Long-Term Holder Net Position Change indicator, which tracks whether investors with a history of long-term holding are adding or reducing exposure, peaked at 163,262 BTC around March 22. By April 5, the figure had dropped to 87,038 BTC, a loss of nearly 47%. Long-term holders are yet to show signs of capitulation, but their confidence levels are clearly diminishing.
The UTXO Realized Price Distribution (URPD), a metric that maps how much supply recently moved at each price level, shows a structural bottleneck that is now just above the current price. There is a 1.7% supply cluster in the current price area, which is around $69,422. This means that 1.7% of the total Bitcoin supply has an underlying price around that level, forming a potential area of selling pressure from market participants looking to break even.
Read also: Solana prices under pressure as selling pressure mounts, will SOL decline continue?
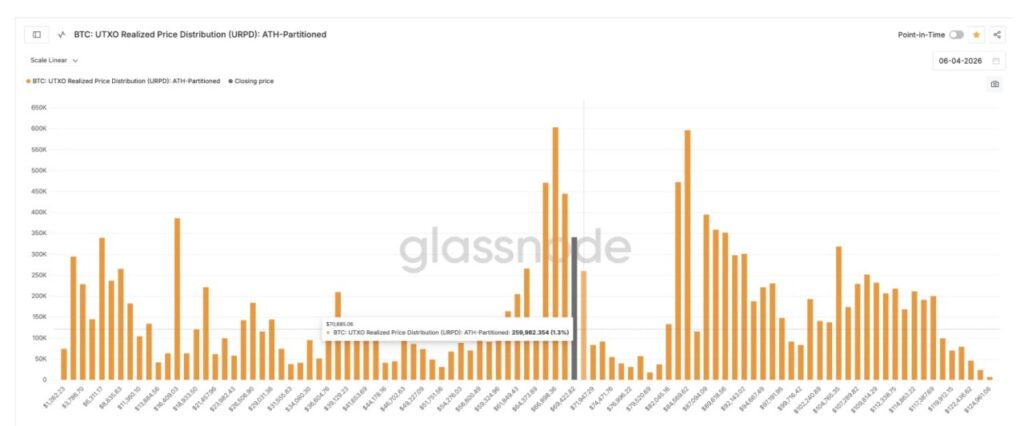
Even so, the cluster dynamics changed quite quickly after that level was passed. At $70,685, the supply concentration dropped to 1.3%. After that, the cluster density reduced quite significantly until it approached the $84,000 area, where the next dense supply zone appeared. The main challenge is to break through the first wall without the support of confidence from whales and long-term holders who are usually the main support for breakouts.
Bitcoin price levels that make the difference between a breakout and another correction
The 8-hour chart (6/4) with the swing that has formed in the period from March 17 to March 25 shows all the important levels to watch this week.
The nearest resistance is at $69,920. If Bitcoin is able to close above that level on the 8-hour chart, it would signal that the 1.7% supply cluster in the current price area is not releasing its assets into the ongoing rally. This would be a notable change from the patterns seen in the previous two divergences.
If it manages to break $69,920, the next target is the swing high at $71,956. Closing above this level will confirm that Bitcoin has broken out of the range it has been in since late March.
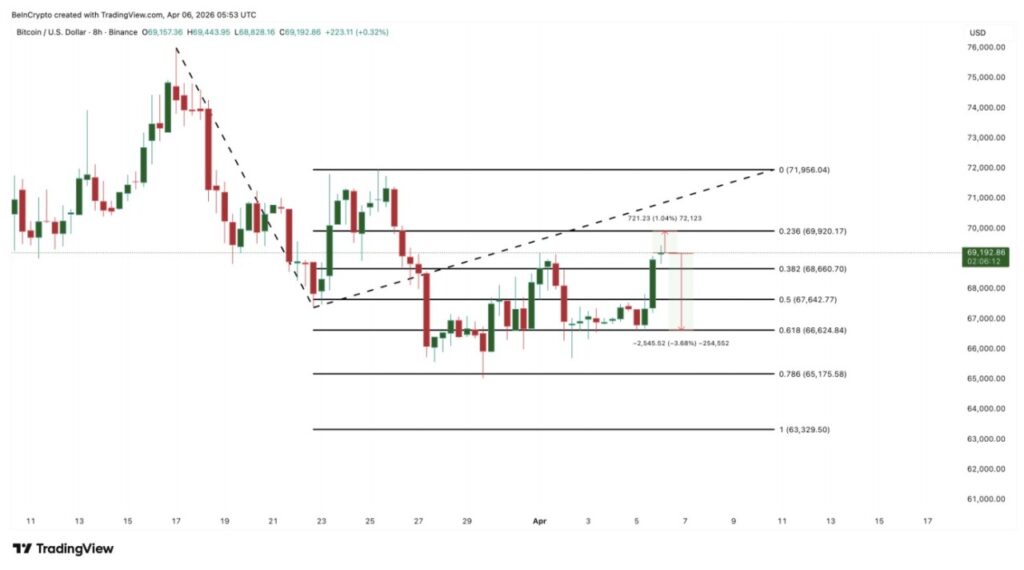
On the downside, $68,660 is the closest support area for BTC. Below that level, $66,624 has served as a strong foothold with multiple touches since late March. If this area is broken, then the price movement structure will weaken significantly and the level of $63,329 becomes the next reference.
A clean close on the 8-hour chart above $69,920 would be an early signal that the divergence is different this time compared to the previous two attempts. Conversely, if Bitcoin fails to hold above $66,624, it would indicate that the on-chain weakness has completely overpowered the technical signals and opens the door for a continuation of the downward movement.
Follow us on Google News to stay up to date with the latest in crypto and blockchain technology. Check Bitcoin price, usdt to idr and tokenized nvidia stock price through Pintu Market.
As a safe crypto app, Pintu provides a crypto trading experience to access crypto gold investment easily and conveniently. You can also see today’ s gold jewelry price and today’s gold bullion price to support your investment activities and portfolio diversification as well as learn crypto through Pintu Academy.
Download the Pintu crypto app via Play Store or App Store now. Enjoy web trading experience with advanced trading tools such as pro charting, various types of order types, and portfolio tracker only at Pintu Pro.
*Disclaimer
This content aims to enrich readers’ information. Pintu collects this information from various relevant sources and is not influenced by outside parties. Note that an asset’s past performance does not determine its projected future performance. Crypto trading activities are subject to high risk and volatility, always do your own research and use cold hard cash before investing. All activities of buying and selling Bitcoin and other crypto asset investments are the responsibility of the reader.
Reference:
- BeInCrypto. Bitcoin Price Flashed 3 Bullish Hints in a Week and None Delivered a Breakout. Accessed on April 7, 2026
Berita Terbaru
© 2026 PT Pintu Kemana Saja. All Rights Reserved.
Kegiatan perdagangan aset crypto dilakukan oleh PT Pintu Kemana Saja, suatu perusahaan Pedagang Aset Keuangan Digital yang berizin dan diawasi oleh Otoritas Jasa Keuangan serta merupakan anggota PT Central Finansial X (CFX) dan PT Kliring Komoditi Indonesia (KKI). Kegiatan perdagangan aset crypto adalah kegiatan berisiko tinggi. PT Pintu Kemana Saja tidak memberikan rekomendasi apa pun mengenai investasi dan/atau produk aset crypto. Pengguna wajib mempelajari secara hati-hati setiap hal yang berkaitan dengan perdagangan aset crypto (termasuk risiko terkait) dan penggunaan aplikasi. Semua keputusan perdagangan aset crypto dan/atau kontrak berjangka atas aset crypto merupakan keputusan mandiri pengguna.