Download Pintu App
Ethereum Climbs to $2,200 Today as 4 Key Indicators Point to a Potential Rebound
Jakarta, Pintu News – Ethereum (ETH) price is at $2,108 on the 12-hour chart as of April 7, down about 1%. At first glance, this movement looks normal and doesn’t show any major changes. However, four different metrics from the technical, derivatives, and on-chain sides are starting to come to the same conclusion, and none of them indicate further weakness.
The last time similar conditions occurred, at least from a technical perspective, the price of Ethereum had rallied up to 16%. Whether the pattern will repeat itself still depends on several key levels that are now getting closer to being tested. Then, how is the current ETH price movement?
Ethereum Price Up 5.58% in 24 Hours
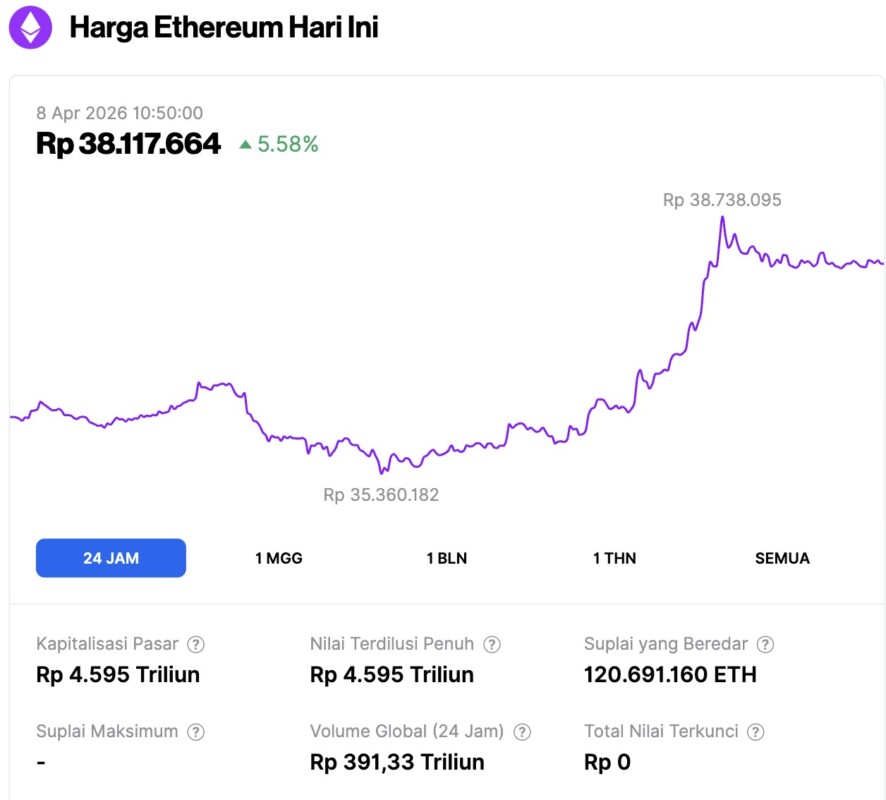
As of April 8, 2026, Ethereum was trading at around $2,233, or approximately IDR 38,117,664, after gaining 5.58% over the past 24 hours. During that time, ETH fell to a low of IDR 35,360,182 before climbing to a daily high of IDR 38,738,095.
At the time of writing, Ethereum’s market capitalization stood at roughly IDR 4,595 trillion, while its 24-hour trading volume jumped 36% to IDR 391.33 trillion.
Read also: Bitcoin Rebounds to $71,000 as US-Iran Ceasefire Lifts Market Sentiment
Technical Triggers on the 12-Hour Chart Begin to Point to the Same Signal
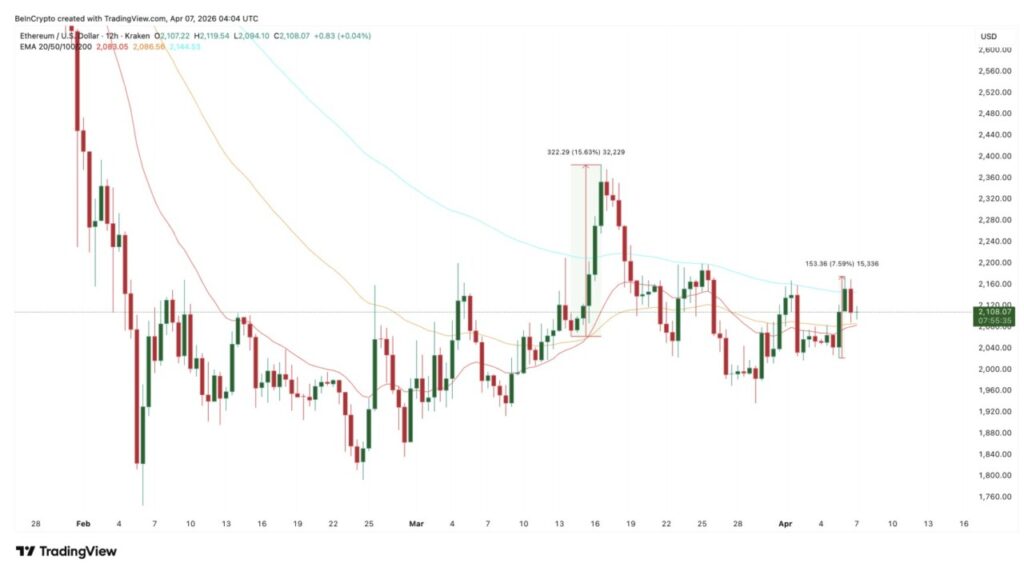
The first metric is the structure of the Exponential Moving Average (EMA), which is a trend indicator that gives greater weight to recent price movements. On the 12-hour chart, the 20-period EMA at $2,083 is now getting closer to the 50-period EMA at $2,086. When the faster EMA breaks above the slower EMA, it forms a bullish crossover which generally signals a short-term change in momentum to the positive.
The same pattern had started forming in mid-March. When the crossover appeared, Ethereum’s price then increased by 15.63%. During that move, ETH also managed to break the 100-period EMA again.
Now, a similar structure is forming again. Since April 5, the price has risen about 7.59%, while the distance between the 20 EMA and the 50 EMA is only about $3. The 100-period EMA is at $2,144, so a confirmed crossover will immediately direct the market’s attention to that area.
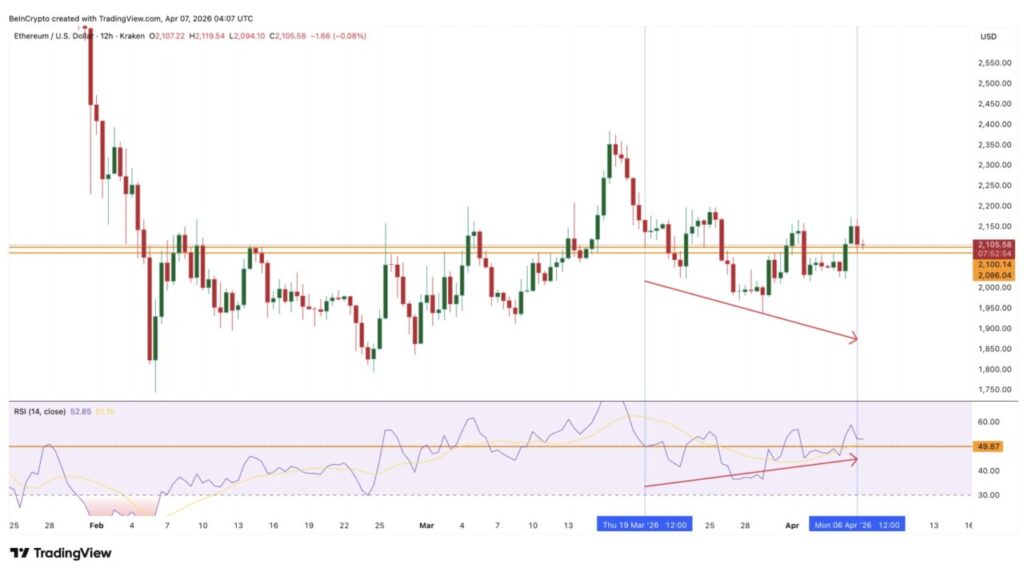
The second metric is the Relative Strength Index (RSI), a momentum oscillator. In the period from March 19 to April 6, the price formed a lower low on the 12-hour chart, while the RSI printed a higher low.
This common bullish divergence shows that selling pressure is starting to weaken even though the price briefly tested lower levels. This divergence signal is still considered valid as long as Ethereum price holds above $2,086. If the price drops through this level, the broader lower low structure has not been completely broken, but the latest swing can no longer be considered a confirmed low until a new pattern is re-established.
All in all, the EMA convergence and RSI divergence are strong enough technical grounds to provide an opportunity for a price bounce. However, technical patterns alone are not enough to move the market. Derivatives and on-chain data are needed to show whether there is a big enough push to support the bounce.
Short Positions Increase, While Whale Has Not Relinquished Holdings
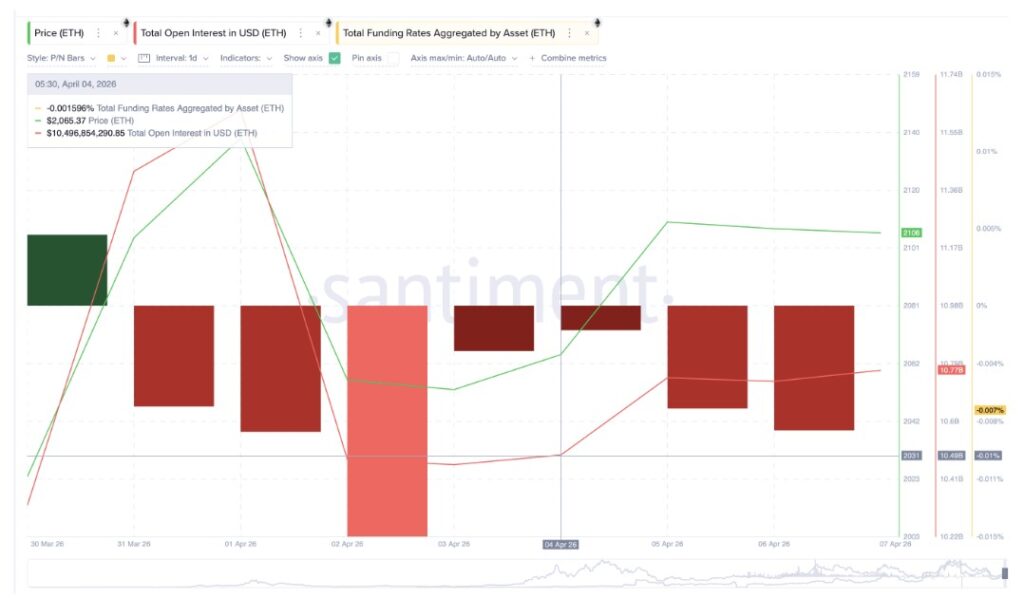
The third metric comes from the derivatives market. On April 4, Ethereum’s total open interest was recorded at $10.49 billion with a funding rate of around -0.0015%. Then on April 7, the open interest rose to $10.77 billion, while the funding rate fell further to -0.007%.
A rise in open interest accompanied by an increasingly negative funding rate indicates one thing: traders are opening more new short positions. This buildup of short positions can fuel the contrarian side, as if prices move against their positions, short traders will be forced to buy back to cover their positions. This can accelerate the price increase through a short squeeze scenario.
Also read: 3 Crypto Token Unlock Schedules in the Second Week of April 2026 to Watch!
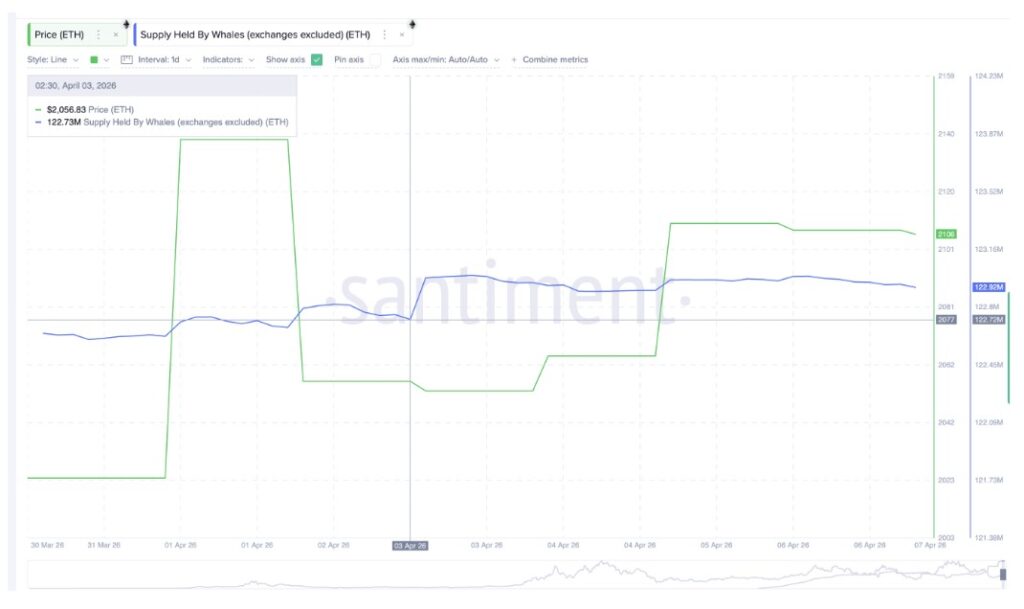
The fourth metric relates to whale behavior. Since April 3, non-exchange wallet whales have increased their holdings from 122.73 million to 122.92 million ETH. The increase of about 190,000 ETH, or roughly $400 million, reflects steady accumulation rather than aggressive buying over a short period of time.
However, the most important point is that whales have not reduced their holdings amid the recent price weakness. They continued to hold assets as prices fell and even added to positions gradually. This provided support in the spot market which was under a potential short squeeze from the derivatives market.
Overall, the technical structure gives clues to the direction of movement. The derivatives market provides contrarian impetus. Meanwhile, whale accumulation forms a support area in the spot market. When these four metrics move in the same direction, the subsequent price levels become a key determinant of whether the bullish scenario will actually materialize.
Ethereum Price Levels that Determine Bounce Validity
The 12-hour chart with the technical levels of the swing that has been formed is now the main reference for reading the crucial areas of price movement.
The first resistance is at $2,116, at the 0.382 level. If Ethereum is able to close above this area on the 12-hour chart, the price will again move above the zone that has the potential to confirm the EMA crossover, so that the upward momentum can further strengthen. After that, the level of $2,172 becomes the most important resistance.
This area has held the price up several times since mid-March, so a solid breakout above it would be an early signal of a more meaningful short-term structural change.
For this bounce to really show convincing strength, Ethereum needs to move towards $2,228 at the 0.618 level, or about 5.77% above the current price. A close above $2,228 would confirm that all four metrics that previously pointed to a potential bounce have actually translated into a real trend change, rather than just a temporary rebound that fizzled out again.
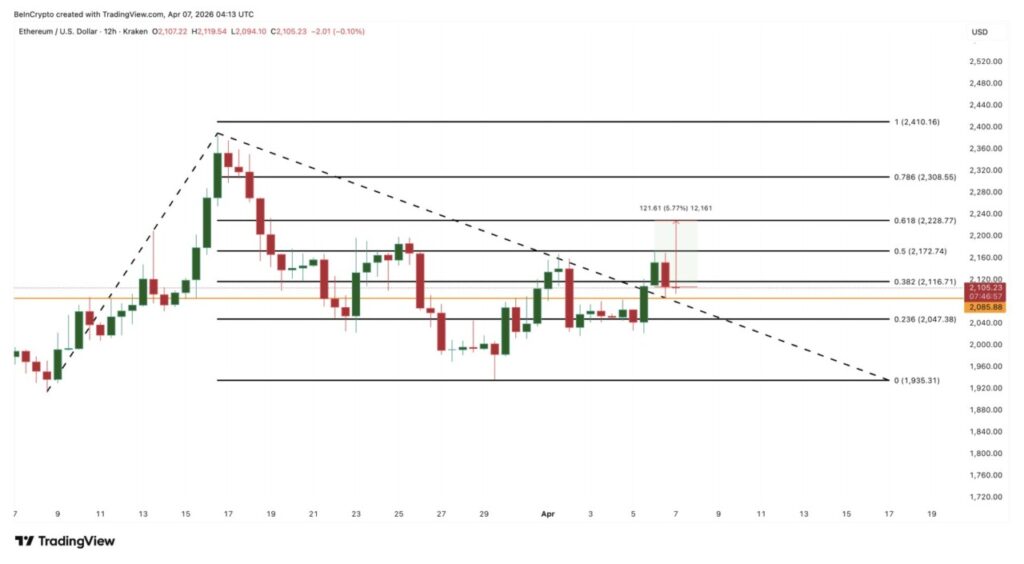
On the downside, the $2,086 level is an important boundary to maintain the validity of the RSI divergence. As long as the price stays above this area, the technical signal is still considered valid. If it drops below it, then the $2,047 area at the 0.236 level will be the closest support.
If the $2,047 level is broken, then the price has the potential to continue its decline to $1,935. Such a scenario would show that the four metrics that had converged in a bullish direction are not strong enough to counter the larger bearish pressure.
To summarize, a 12-hour chart close above $2,172 would be a major confirmation that the bounce scenario supported by the four metrics is really starting to play out. Conversely, failure to defend the $2,086 level would delay the opportunity and make Ethereum price vulnerable to test the $1,935 area again.
Follow us on Google News to stay up to date with the latest in crypto and blockchain technology. Check Bitcoin price, usdt to idr and tokenized nvidia stock price through Pintu Market.
As a secure crypto app, Pintu provides a crypto trading experience to access crypto gold investment easily and conveniently. You can also see today’ s gold jewelry price and today’s gold bullion price to support your investment activities and portfolio diversification as well as learn crypto through Pintu Academy.
Download the Pintu crypto app via Play Store or App Store now. Enjoy web trading experience with advanced trading tools such as pro charting, various types of order types, and portfolio tracker only at Pintu Pro.
*Disclaimer
This content aims to enrich readers’ information. Pintu collects this information from various relevant sources and is not influenced by outside parties. Note that an asset’s past performance does not determine its projected future performance. Crypto trading activities are subject to high risk and volatility, always do your own research and use cold hard cash before investing. All activities of buying and selling Bitcoin and other crypto asset investments are the responsibility of the reader.
Reference:
- BeInCrypto. Ethereum Price Corrects but 4 Metrics Are Quietly Building a Bounce Case. Accessed on April 8, 2026
Berita Terbaru
© 2026 PT Pintu Kemana Saja. All Rights Reserved.
Kegiatan perdagangan aset crypto dilakukan oleh PT Pintu Kemana Saja, suatu perusahaan Pedagang Aset Keuangan Digital yang berizin dan diawasi oleh Otoritas Jasa Keuangan serta merupakan anggota PT Central Finansial X (CFX) dan PT Kliring Komoditi Indonesia (KKI). Kegiatan perdagangan aset crypto adalah kegiatan berisiko tinggi. PT Pintu Kemana Saja tidak memberikan rekomendasi apa pun mengenai investasi dan/atau produk aset crypto. Pengguna wajib mempelajari secara hati-hati setiap hal yang berkaitan dengan perdagangan aset crypto (termasuk risiko terkait) dan penggunaan aplikasi. Semua keputusan perdagangan aset crypto dan/atau kontrak berjangka atas aset crypto merupakan keputusan mandiri pengguna.