6 Best Crypto Analysis Tools

Rekomendasi 6 web analisis crypto
Cryptocurrency markets are known for their transparency, as investors can easily access various important data related to crypto assets. This is where crypto analysis tools come in handy, as they make it easier for investors to conduct research. There are many free crypto analysis platforms available, each offering a range of features such as financial metrics, performance data, transaction information, and technical charts. In this article, we will introduce you to some of the top crypto analysis tools and the features they offer.
Article Summary
- 🔗 Blockchain technology makes all crypto data easily accessible. However, with so much data available, it can be overwhelming for investors to try to make sense of it all on their own. Crypto analysis tools help investors find, filter and analyze the data in a more organized and meaningful way.
- 📊 Crypto analysis tools allow users to track various financial metrics, performance, transaction data, and technical charts of a crypto asset or a specific sector.
- 📝 By using crypto analysis tools, an investor can deepen their fundamental research and get various interesting insights.
Crypto Analysis Tools
The crypto industry has always emphasized the importance of transparency. The majority of crypto projects provide access to various data related to the project. Investors can access this data directly from the project’s website or through third-party analysis platforms.
By using crypto analysis tools, investors can conduct in-depth analysis by digging into various data points and metrics. These tools can also help investors track trends in the crypto industry through on-chain data and gain insights into the conditions of specific sectors.
Do not miss it! Learn more about how to do on-chain analysis in the following article
Data for specific projects or sectors is easily accessible because it is open source, although it may be scattered and very large. Investors can use analysis platforms to collect and filter the data they need. In-depth analysis can help investors identify opportunities and make more informed decisions. Currently, many crypto analysis tools can be accessed for free. Here are some crypto analysis tools that you can use:
Six Free Crypto Analysis Tools
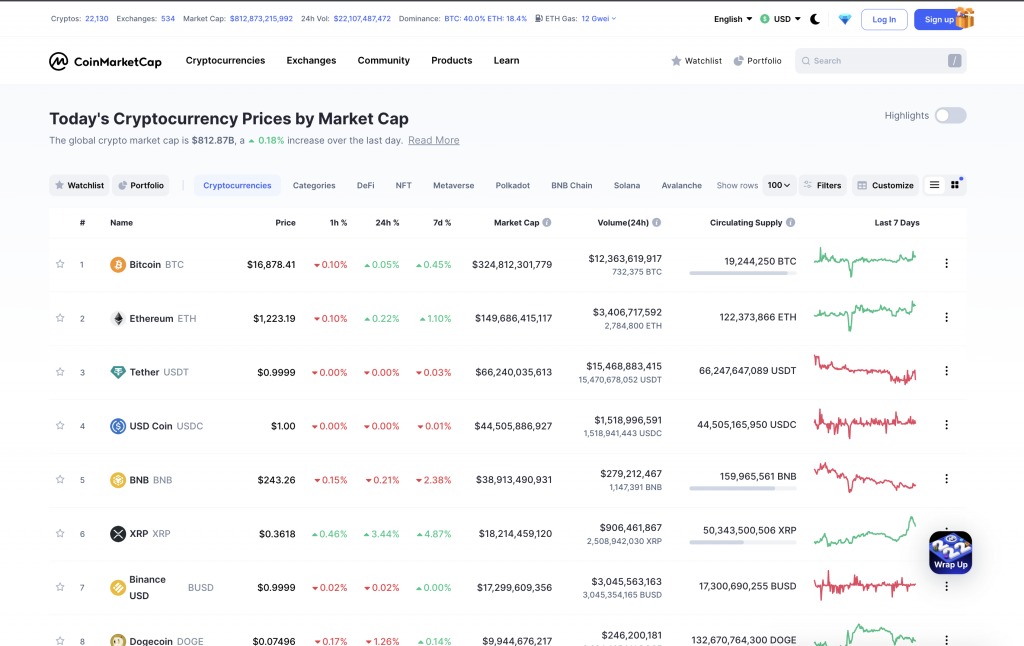
1. CoinMarketCap
Best for: As a starting point to check prices, market capitalization, and various information related to a crypto asset or a blockchain.
CoinMarketCap is a free crypto analysis tool to see real-time price movements and market capitalization of crypto assets. CoinMarketCap also has a ranking of crypto assets based on their market cap value. Users can use the sort and filter features to arrange the ranking based on several categories. For example, Non-Fungible Token (NFT) based crypto assets, Decentralized Finance (DeFi), Metaverse, and others. CoinMarketCap can also be used to view data on an exchange, such as trading volume, average liquidity, visit rates, and other data.
You can get to know more about NFT world and its uses in the following article.
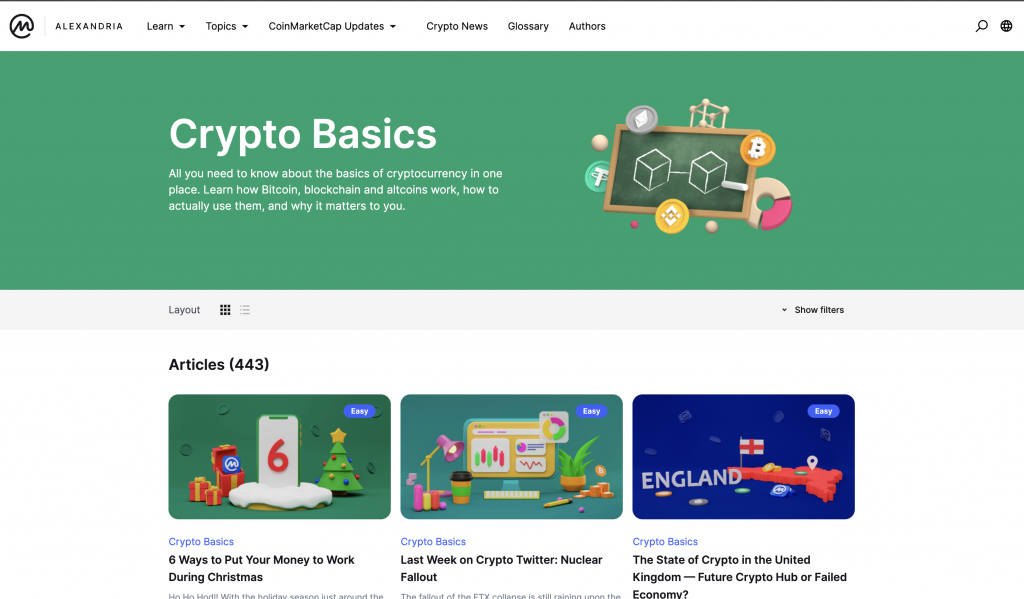
CoinMarketCap also has various other features that make it easier for users to make an analysis. For example, there is an on-chain data and a blockchain explorer feature. Not only that, CoinMarketCap has a dashboard called CMC Alexandria, which contains various articles about crypto. You can learn about terms, basic knowledge, and crypto technology. You can enjoy all the features and information on CoinMarketCap for free.
CoinMarketCap Key Feature:
- Track price movements, market caps, ranking, and other information for all crypto assets and the crypto industry.
- Keep track of transaction volumes, liquidity, and visitation rates on exchanges (spot, derivatives, and DEX)
- On-chain data dashboard to view crypto pairs on DEX and blockchain ranking based on TVL value and several protocols.
- Blockchain explorer dashboard that tracks all detailed information such as total transactions, TPS rate, hash rate, block height, etc.
- CoinMarketCap Indices, an index to measure the performance of the top 200 crypto assets by market cap.
- Calendar of all crypto activities and calendar of Initial Coin Offering (ICO) of crypto assets.
- CMC Alexandria, a dashboard that contains various educational and informational tools on all topics about cryptocurrencies.
As a trusted source of information, CoinMarketCap is useful as a starting reference. With various information and data, you can deepen your analysis and get insights about a crypto asset or the crypto industry itself.
2. Token Terminal
Best for: Tracking and analyzing the financial metrics of a protocol, such as revenue and profits, and comparing financial conditions between protocols.
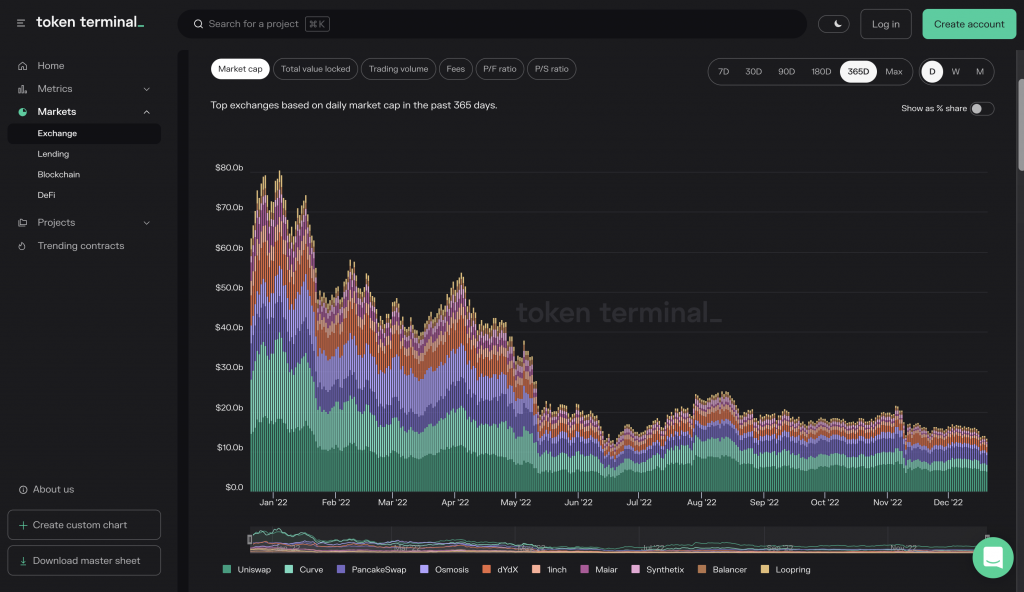
Token Terminal is a crypto analysis tool that can help investors compare the financial metrics of various protocols. Apart from the financial metrics of the crypto projects, users can also view the metrics of a sector in the crypto industry. These sectors include exchanges, lending, blockchain, and Decentralized Finance (DeFi).
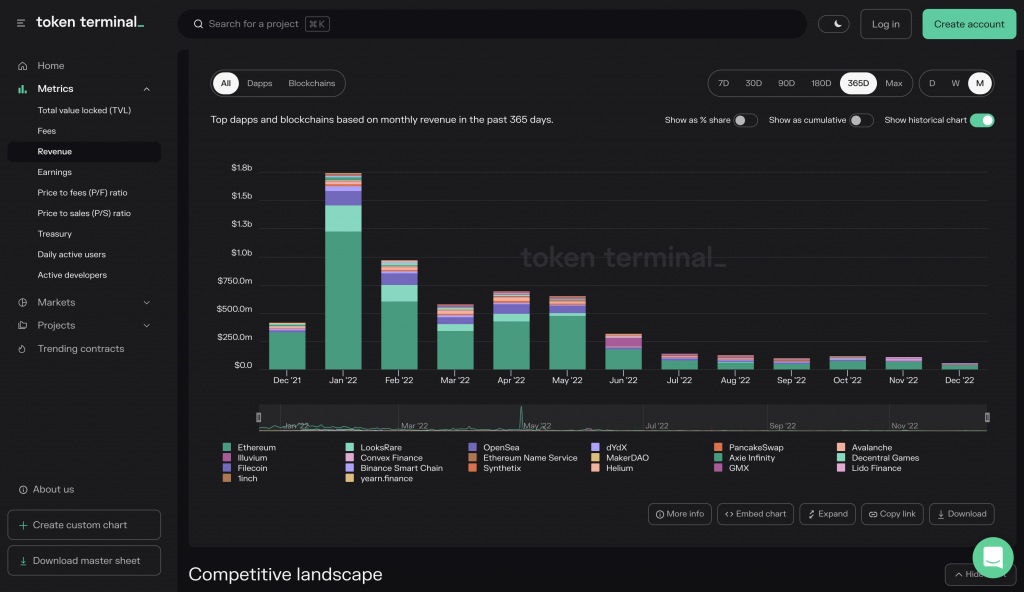
Every metric and data in Token Terminal are visualized through a graph. Users can set the chart time from daily, weekly, or monthly.
Currently, Token Terminal offers two packages. The unpaid package includes aggregate data and leaderboards, while the paid package, provides additional features such as access to all data on the Token Terminal website, customized charts, tables, and denominations, and downloading the data into an Excel/CSV file. The subscription fee for the paid package is 325 euros per month.
Token Terminal key features:
- Financial metrics of a crypto project, such as market capitalization, revenue, and net profit.
- Advanced financial metrics such as price-to-sales ratio (P/S), price to fees ratio (P/E), total value locked (TVL), and gross merchandise volume (GMV).
- Dedicated dashboard to view the most popular contracts on the Ethereum, Polygon, Optimism, Avalanche, and Arbitrum networks
- Weekly fundamental reports covering various information about the crypto industry.
- Token Terminal Pro users can customize their query data using the API key.
- Customized graphs and tables from a single data.
- Downloading data from the dashboard into Excel/CSV files.
By knowing the various financial metrics of a project, Token Terminal can help deepen your research. With Token Terminal you can find out how much income a project gets, the potential benefits a project receives, its financial condition, and comparison with other projects.
In the following article, you can learn more about how to do a fundamental analysis of a crypto asset.
3. Dune Dashboard
Best for: Conduct data research related to crypto projects using data dashboards.
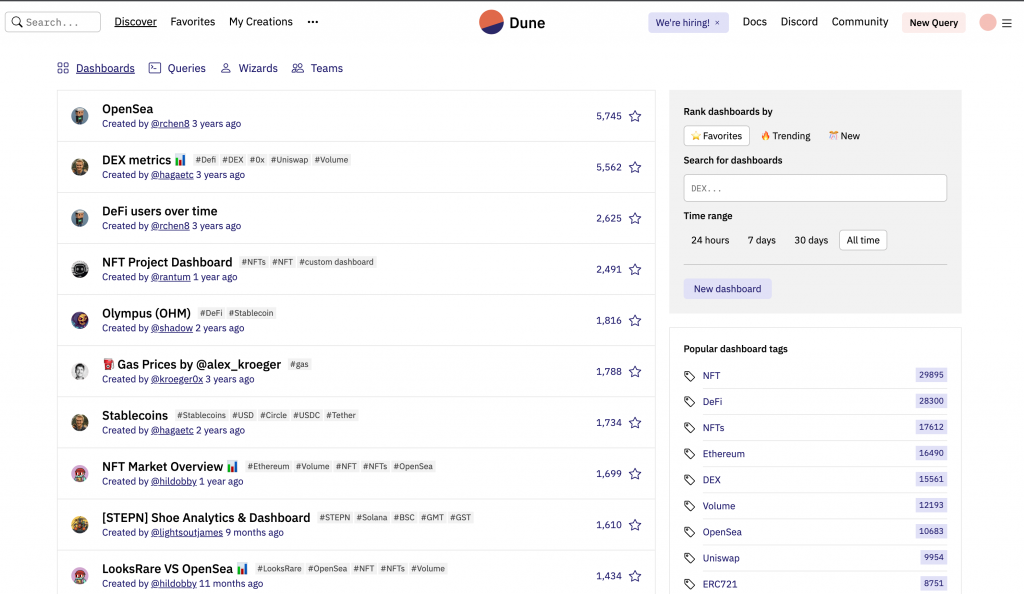
The next crypto analysis tool is Dune Dashboard, a community-based data provider platform. Since Dune is a user-generated content platform, all existing data is created and uploaded by its users. Through the Dune dashboard, users can search and publish real-time data related to the blockchain and crypto industry.
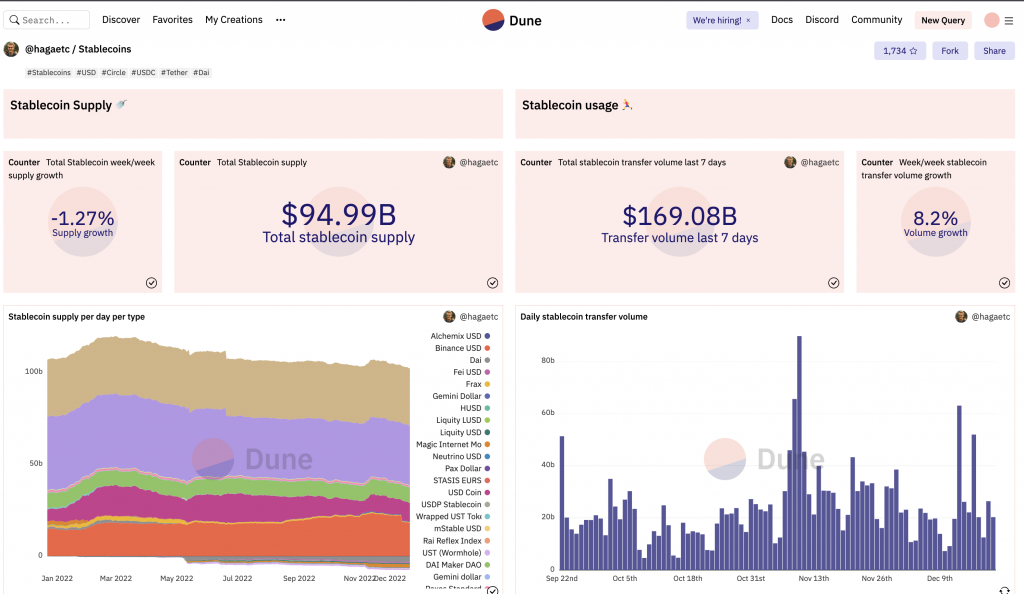
The easiest way to use Dune is to find a dashboard filled with data that other people have created.
Here is a tip: a dashboard with many stars means the data generated is much more reliable because other users also make that dashboard as their favorite.
However, if you can’t find the dashboard or data you are looking for, you always can create your own dashboard. To do this, the user must make a query and select the database network they want to use. Then you need to write Standard Query Language (SQL) according to the data you are looking for. After that, Dune will process it automatically and visualize it in charts or graphs.
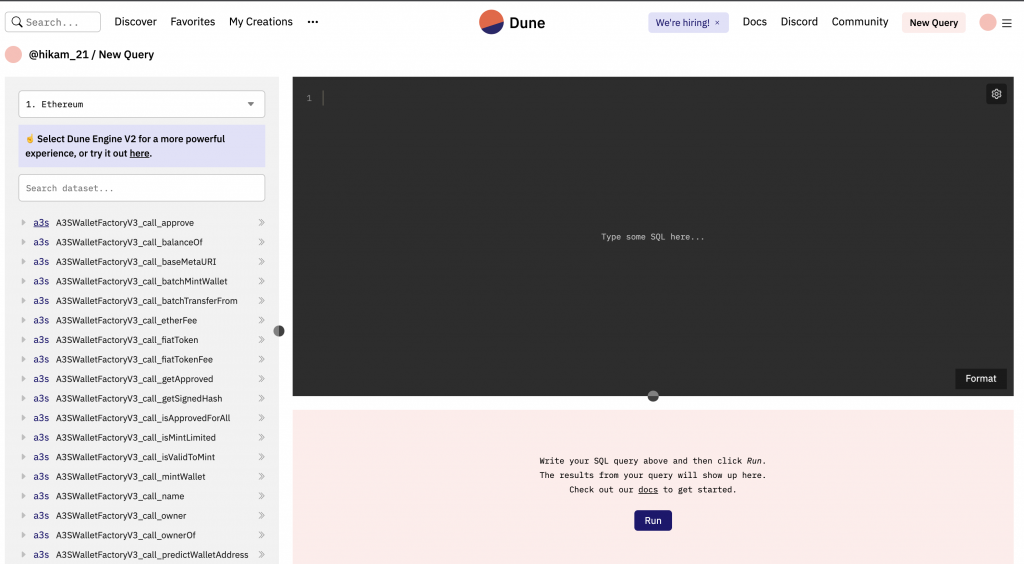
The majority of Dune’s features can be used for free. Users only need to create an account to get access to these features. Dune also offers a paid package with more exclusive features, which costs $69-1,337 per month.
Dune Dashboard key features:
- The dashboard contains data and insights related to a protocol or a sector such as Non-Fungible Token (NFT), DeFi, and the blockchain ecosystem.
- Access to various data and metrics on blockchains such as Ethereum, Polygon, Optimism, Gnosis Chain Binance Smart Chain, and Solana, as well as data from smart contracts created on those blockchains.
- Simple visualization and categorized queries make the dashboard easier to read.
- Can create a custom dashboard by making a query.
- Using the SQL programming language, which tends to be easy to learn.
- Can change the format of query results to CSV files (on paid Dune packages)
By using Dune, you can explore and find insights regarding potential changes in trends in the crypto industry. For example, when finding a change in transaction volume on a platform, or knowing how busy the transaction volume is, or the number of active project users in a certain period. These things help you take hypotheses and determine the steps that must be prepared in the future.
Regarding smart contracts, find out more about the details in the following article
4. Artemis
Best for: Compare and evaluate layer-1 networks through easy-to-read metrics.
Artemis has similarities with Token Terminal as a crypto analysis tool that displays various data on crypto projects. Artemis is a dashboard that shows various metrics to assist users in finding insights related to layer-1 networks. Currently, Artemis has two main features, GokuStats and Artemis Sheets. Fourteen blockchain networks can be checked using Artemis. Some of them are Avalanche, Arbitrum, BSC, Cardano, Ethereum, Polygon, and Solana.
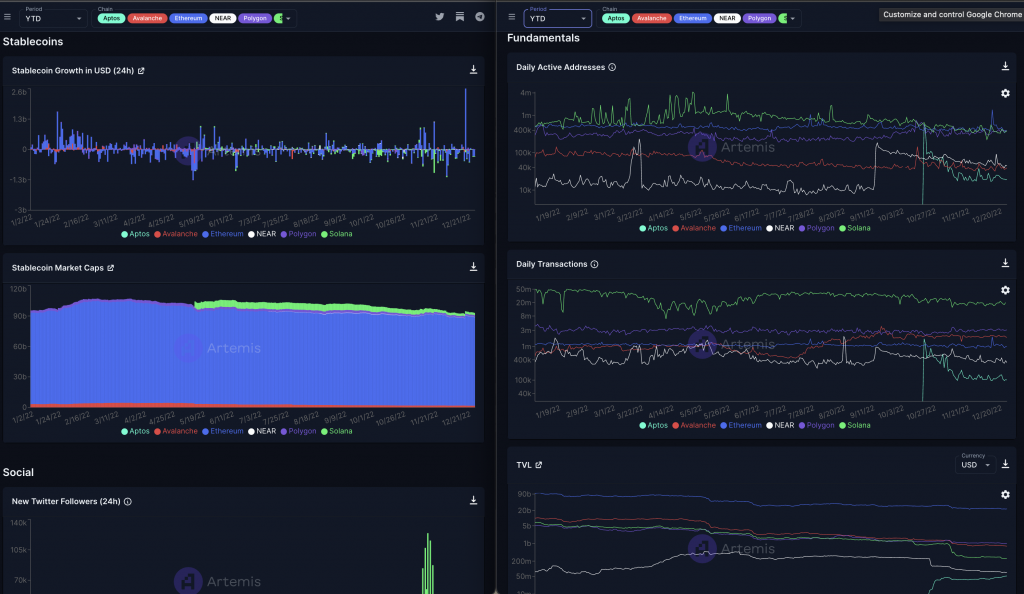
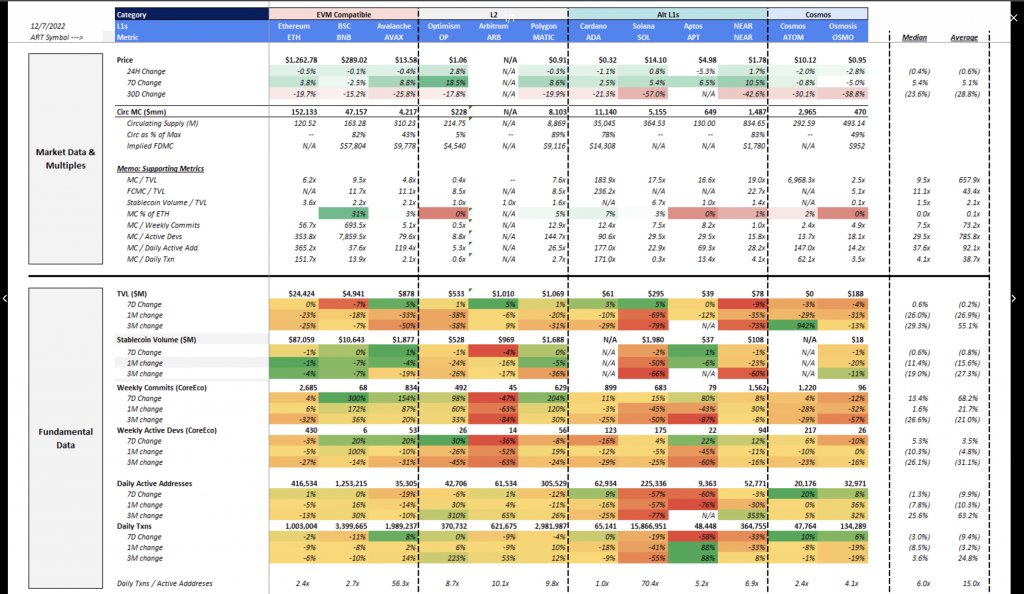
GokuStats is a dashboard for analyzing multiple Layer-1 blockchains by comparing metrics like TVL, daily transactions, developer team activity, active users, and more. Meanwhile, Artemis Sheets are plug-ins in the form of Microsoft Excel and Google Sheets. Using Artemis Sheets, users can get various templates in the form of sheets that will help evaluate portfolio performance, compare the trading behavior of multiple tokens, and deep dive into specific tokens or protocols.
Users can use Gokustats features for free. Meanwhile, users must subscribe for US$100 per month for Artemis Sheets. However, for users who want to try the Artemis Sheets feature first, there is a 14-day free trial program.
Artemis Key Features:
- Displaying metrics for comparing and analyzing Layer-1 networks.
- The dashboard contains various data metrics, including developer activities, daily active addresses, transactions, TVL, stablecoin flows, market data, and valuations.
- Dashboards that show the number of weekly commits and weekly active developers for a particular crypto ecosystem over time.
- Plugin in the form of Excel/Sheets containing templates of various metrics (Artemis Premium)
- All metrics and data are integrated with Token Terminal
- Visualization of data in graphs and tables that are easy to understand.
Artemis can help you find and read trends in a particular project or sector. You can make much better decisions by having data related to trends that are happening in real-time.
Apart from Layer-1, there are several other layers in the blockchain that you can learn about in the following article.
5. Trading View
Best for: Carry out technical analysis of crypto assets in real-time
If the previous crypto analysis tools were in the form of data and dashboards, this time, the platform is chart-based. For crypto investors who rely on technical analysis, TradingView is a must-have crypto analysis tool. With TradingView, traders can perform technical analysis with real-time asset price data.
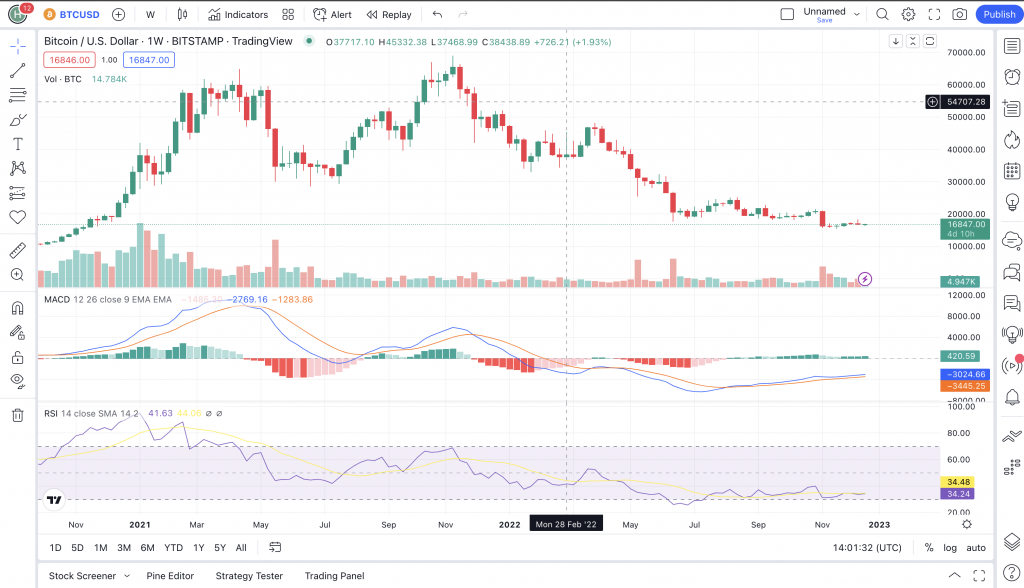
TradingView is a jack of all trades for traders who rely on technical analysis. The reason is that TradingView has at least 100,000 technical indicators and strategies that its users can use. In addition, TradingView also offers a variety of tools that can assist in carrying out technical analysis, such as heat maps, drawing tools, screeners, and many more.
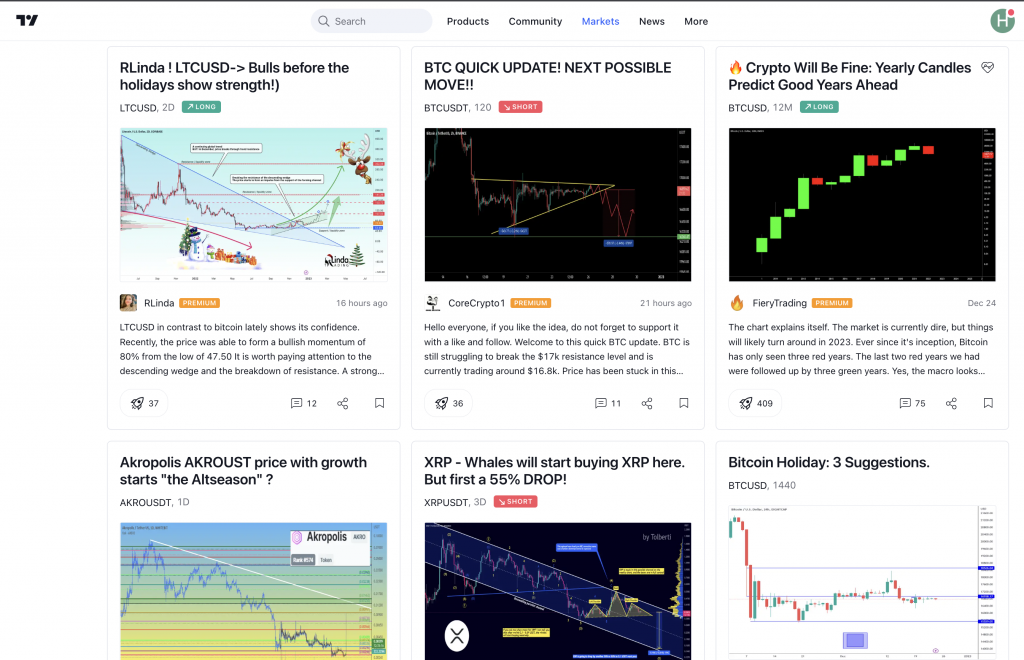
TradingView also has a strong community base. Based on User Generated Content, users can share trading strategies and insights related to the market or an asset. The various features offered by TradingView can be enjoyed for free. Traders only need to register an account to get it. However, to enjoy a variety of more advanced features, users can subscribe to the Pro package for US$14.95 per month, Pro+ for US$29.95 per month, and Premium for US$59.95 per month.
TradingView key features:
- More than 100,000 technical indicators and strategies based on user-generated content can be used for technical analysis.
- Has many tools such as charts, drawing tools, heat maps, screeners, timeframes, etc.
- Customized screen charting, display of multi-frame analysis, candlestick recognition, volume profile, etc.
- Alarm feature for up-to-date price notifications based on 12 different conditions.
- TradingView users can look for ideas and references through the discussion space among users.
- Has a variety of educational materials about technical analysis for free.
- Backtesting feature that allows users to test previously made strategies based on existing historical data
By using TradingView, you can combine fundamental research results with technical analysis. TradingView can also be a great tool for learning technical analysis with various tools and indicators that can be used for free. Users can also use TradingView as a place to create trading strategies.
Interested in trying technical analysis? Find out how to do it in the following article
6. DeFi Llama
Best for: Looking for data and insights related to the DeFi industry, including various DeFi applications and protocols.
Another popular platform for crypto analysis is DeFi Llama. As DeFi is not centralized, all its data and activity become difficult to track. As an aggregator dashboard, DeFi Llama makes it easy for users to track and analyze all DeFi data and transaction activity in one place. So far, DeFi Llama has followed 2,120 DeFi protocols from 158 different blockchain networks, some of which are Ethereum, Avalanche, Fantom, Cardano, and others.
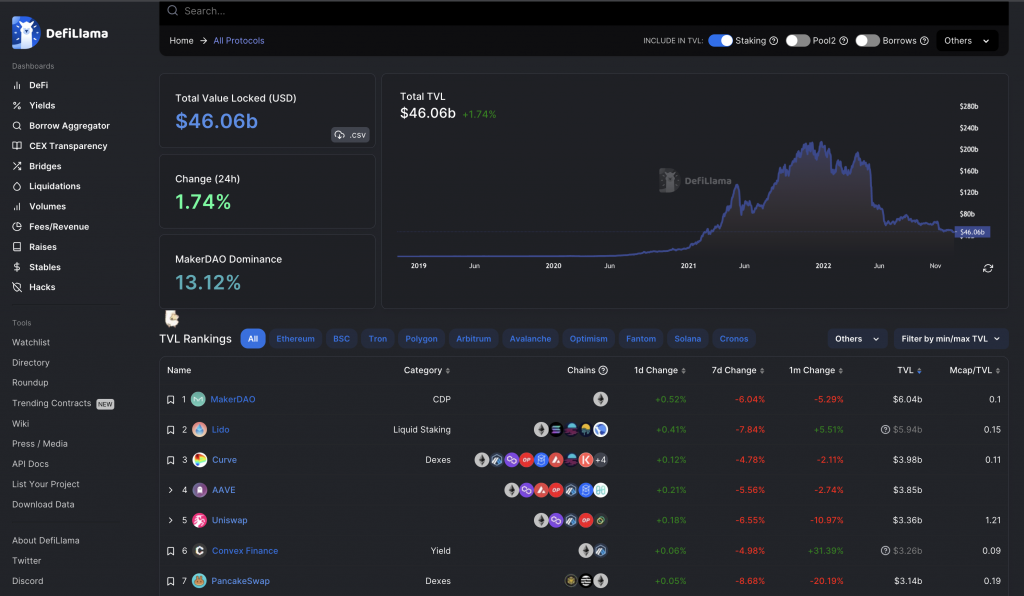
One of the DeFi Llama metrics is the TVL of all existing DeFi. The TVL metric displays how much money is connected to each Dapps. In addition, users can also sort the TVL ranking of a DeFi based on its blockchain. For example, if the selected blockchain is Avalanche, then DeFi Llama will rank the TVL Dapps on the Avalanche network.
DeFi Llama Key Features:
- Data and metrics related to the DeFi industry, DeFi oracles, DeFi forks, DeFi airdrops, liquidation levels in DeFi, to NFTs.
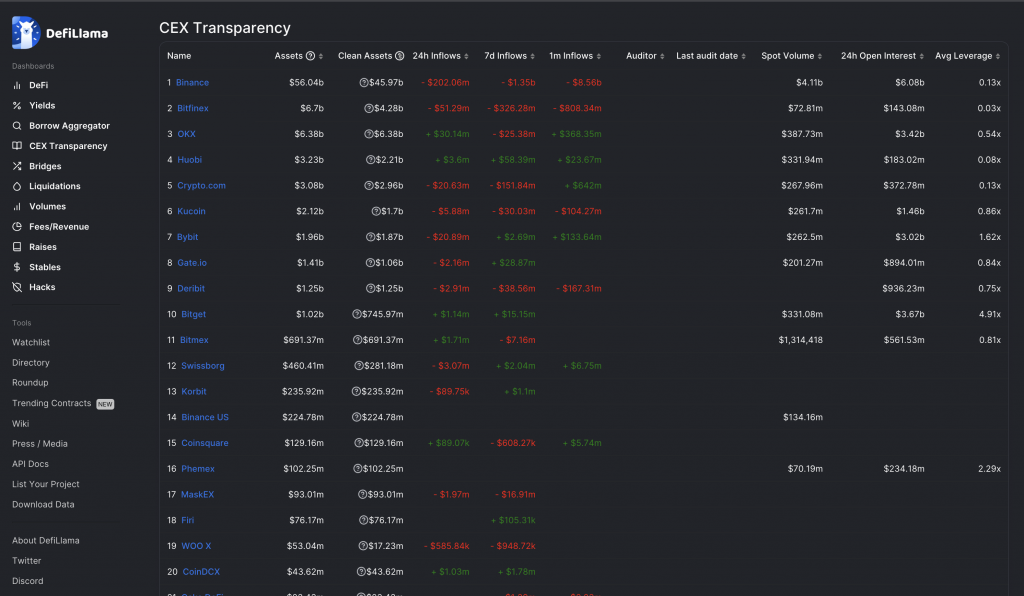
- A dashboard that contains Centralized Exchange (CEX) transparency metrics. Users can see the number of assets owned by CEX and the flow of funds entering or leaving the CEX.
- Dashboard for tracking hacks that occur on various blockchains.
- All data in DeFi Llama can be integrated with other websites.
- DeFi Llama provides the entire dashboard and tools for free.
For investors who want to invest in DeFi, DeFi Llama and its tools can help deepen research and read trends. The development team also can use the API to integrate important statistics into their website to show the growth of the DeFi ecosystem.
In the following article, you can explore and understand the DeFi ecosystem.
Conclusion
Fundamental research is one of the most critical things when buying a crypto asset. Through in-depth research, investors can find out the quality and prospects of a project and trends that are or will occur. The existence of crypto analysis tools certainly makes it easier for investors to deepen their research.
However, using crypto analysis tools will not necessarily make an investment successful. Crypto analysis tools cannot guarantee the accuracy of success. Everything will come back to the user’s ability to interpret data and draw conclusions. As the anecdote “the man behind the gun” said, the quality of the person holding the weapon is far more important than the quality of the gun itself.
Thus, all the convenience offered by the various crypto analysis tools means nothing if the user does not master the instrument. Therefore, as users, we should continue to polish our skills to make the most of these crypto analysis tools.
Start Investing at Pintu
Don’t forget to use various data from the crypto analysis tool when investing. You can invest in various crypto assets such as BTC, BNB, ETH, and others safely and easily through Pintu.
Pintu is also compatible with popular wallets such as Metamask to facilitate your ttransactions. Download Pintu app on Play Store and App Store! Your security is guaranteed because Pintu is regulated and supervised by Bappebti and Kominfo.
In addition to executing transactions, in the Pintu Apps, you can also learn more about crypto through various Pintu Academy articles which are updated every week! All Pintu Academy articles are made for knowledge and educational purposes, not as a financial advice.
Reference
Token Terminal. Launching the Terminal. Accessed on 27 December 2022.
Valerio Puggioni, What Is Dune Analytics And How To Use It? CoinGecko. Accessed on 27 December 2022.
Renata Liubertaite. 9 Best On-Chain Analysis Tools In 2022. Dexter Lab. Accessed on 27 December 2022.
Alan W. What Is DeFi Llama: A DeFi Analytics Dashboard for Professional DeFi Traders. Phemex. Accessed on 27 December 2022.
Share
Related Article