Will Bitcoin (BTC) Continue to Lose Money? Check out the Latest Analysis!

Jakarta, Pintu News – Bitcoin has recently experienced a significant drop, failing to hold above the $115,500 zone and starting a new decline. Now, the cryptocurrency is under pressure, with the big question: will the bears take over completely?
Current Bitcoin Market Conditions
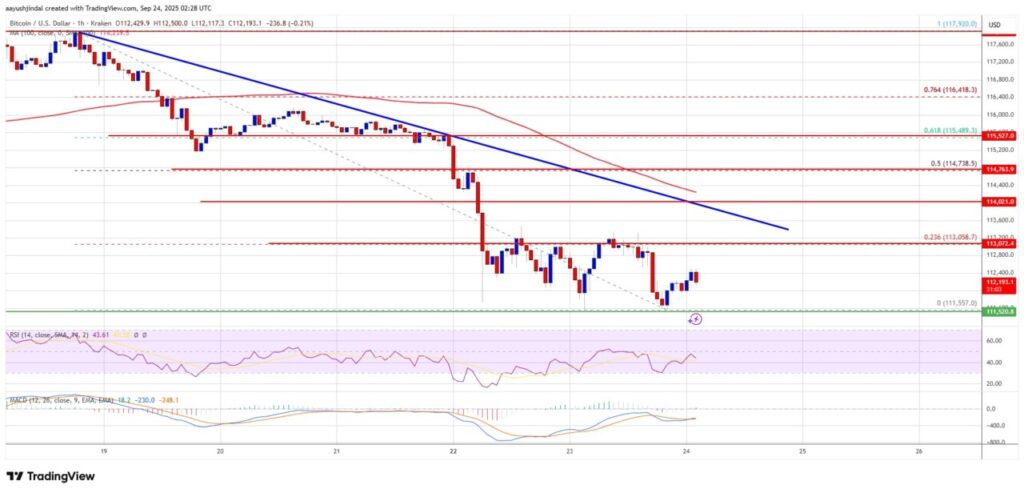
Bitcoin (BTC) has lost momentum above $115,000 and dropped below the $114,000 support level, entering a short-term bearish zone. The decline accelerated after Bitcoin (BTC) fell below $113,500. A new low was formed at $111,557, and currently Bitcoin (BTC) is consolidating losses.
The currency is trading below $113,200 and the 100 hourly simple moving average. There is a bearish trend line forming with resistance at $113,600 on the hourly chart of the Bitcoin (BTC)/USD pair. The next immediate resistance is near $113,000, with the first key resistance at $113,500 alongside the trend line. The next resistance may be at $114,000.
Also Read: 5 Key Points of Arthur Hayes’ Analysis: Bitcoin (BTC) Could Reach Rp56 Billion by 2028?
Bitcoin Price Recovery Potential
If Bitcoin (BTC) manages to break the $114,000 resistance, there is a possibility that the price will go higher. In that scenario, Bitcoin (BTC) could try to break $114,750 or the 50% Fib retracement level of the last drop from $117,920 to $111,557. Further gains would probably push the price towards $115,500, with the next resistance at $116,250.
However, the success of this relies heavily on Bitcoin’s (BTC) ability to break some of the key resistance levels that have formed. The market is currently showing signs of volatility with technical indicators showing stronger bearish momentum.
Risk of Further Decline
If Bitcoin (BTC) fails to break through the $114,000 resistance zone, there could be a new drop. Immediate support is near $112,000, with the next major support at $111,750. The next support is the $110,500 zone.
A further drop would probably take the price towards $108,800 support in the short term, with key support at $107,500. A break below could trigger stronger bearish momentum, putting Bitcoin (BTC) at risk of further declines. The hourly MACD indicator is currently showing acceleration within the bearish zone, and Bitcoin (BTC)/USD’s hourly RSI (Relative Strength Index) is now below the 50 level.
Conclusion
Current market dynamics show that Bitcoin (BTC) is under significant pressure. Investors and traders should pay attention to key resistance and support levels to make informed decisions. Going forward, it is imperative to monitor technical indicators and market developments to understand the direction of the next Bitcoin (BTC) price trend.
Also Read: Deutsche Bank Predictions About Bitcoin (BTC) Becoming Central Bank Reserves in 2030!
Follow us on Google News to get the latest information about the world of crypto and blockchain technology. Check today‘ s bitcoin price, today’s solana price, pepe coin and other crypto asset prices through Pintu Market.
Enjoy an easy and secure crypto trading experience by downloading Pintu crypto app via Google Play Store or App Store now. Also, get a web trading experience with various advanced trading tools such as pro charting, various types of order types, and portfolio tracker only at Pintu Pro.
*Disclaimer
This content aims to enrich readers’ information. Pintu collects this information from various relevant sources and is not influenced by outside parties. Note that an asset’s past performance does not determine its projected future performance. Crypto trading activities are subject to high risk and volatility, always do your own research and use cold hard cash before investing. All activities of buying andselling Bitcoin and other crypto asset investments are the responsibility of the reader.
Reference
- NewsBTC. Bitcoin Price Struggles Near $11.5K. Accessed on September 25, 2025