Download Pintu App
Fibonacci Retracement: A Technical Analysis Guide for Traders in the Bitcoin and Crypto Markets
Jakarta, Pintu News – Fibonacci retracement is a popular technical analysis tool among crypto traders, including in Bitcoin (BTC) trading. This tool helps identify potential support and resistance levels based on the mathematical ratios of the Fibonacci sequence. By understanding how Fibonacci retracement works, traders can make more informed decisions on market entry and exit points.
What is Fibonacci Retracement?
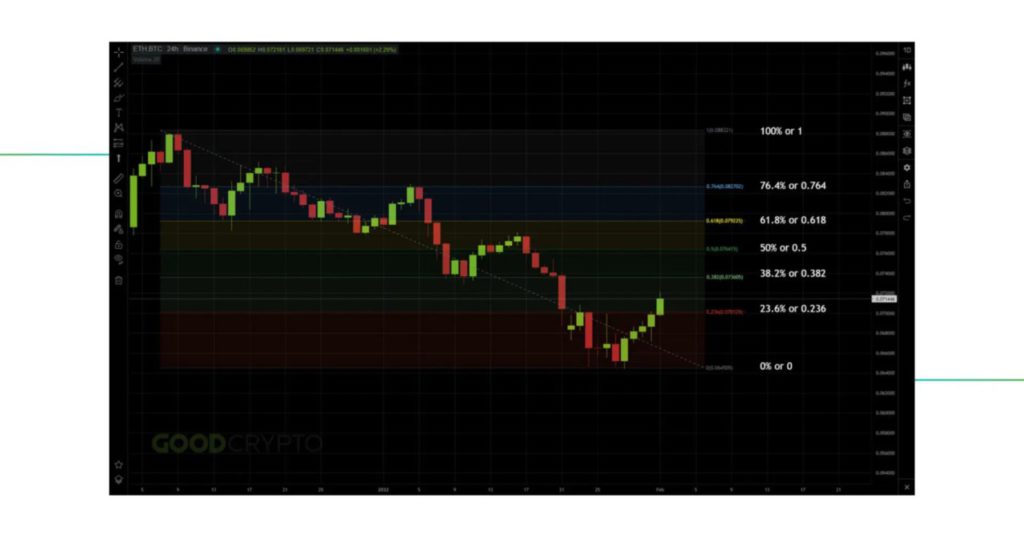
Fibonacci retracement is based on the Fibonacci sequence of numbers, where each number is the sum of the previous two numbers (for example, 0, 1, 1, 2, 3, 5, 8, 13, 21, and so on). From this sequence, important ratios such as 23.6%, 38.2%, 50%, 61.8%, and 78.6% are derived which are used to identify retracement levels on the price chart.
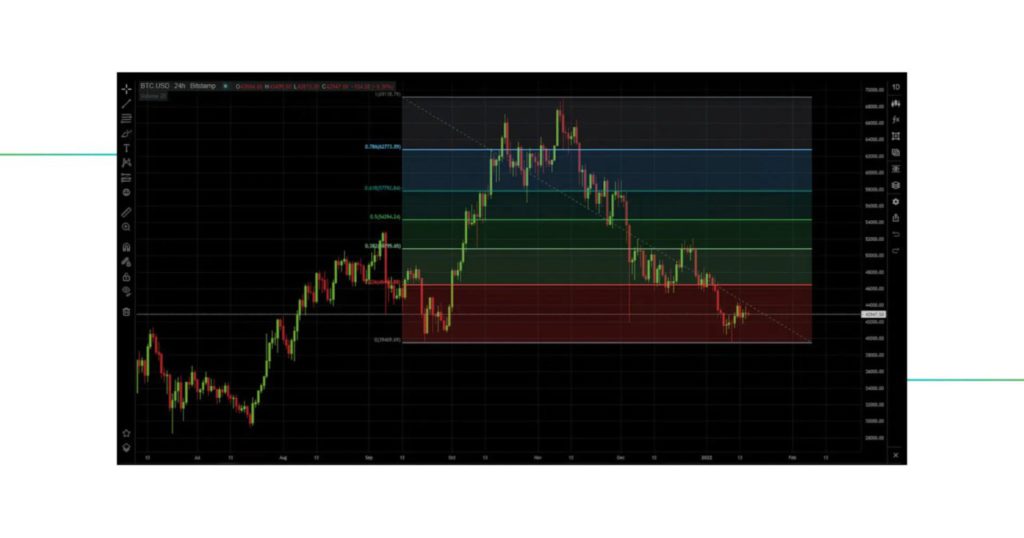
In practice, traders draw Fibonacci retracement lines between two extremes on the price chart-usually from a swing high to a swing low in an uptrend, or vice versa in a downtrend. Horizontal lines are then drawn at those retracement levels to identify potential areas where the price may experience a reversal or consolidation.
Also Read: XRP Futures Launches on CME: A New Beginning for Crypto Investing!
Why Fibonacci Retracement is Important in Crypto Trading?
The cryptocurrency market is known for its high volatility, making it important for traders to have tools that can help identify price reversal points. Fibonacci retracement provides a framework for anticipating areas where prices might pause or reverse direction, allowing traders to plan more effective entry and exit strategies.
The 61.8% level, known as the “golden ratio,” is often considered the most significant retracement level. Many traders observe this level as a potential area for trend reversal or continuation of an ongoing trend.
How to Use Fibonacci Retracement in Bitcoin Trading
- Identify the Major Trend: Determine whether the market is in an uptrend or downtrend.
- Select the Swing High and Swing Low Points: In an uptrend, draw a line from the swing low to the swing high. In a downtrend, draw a line from the swing high to the swing low.
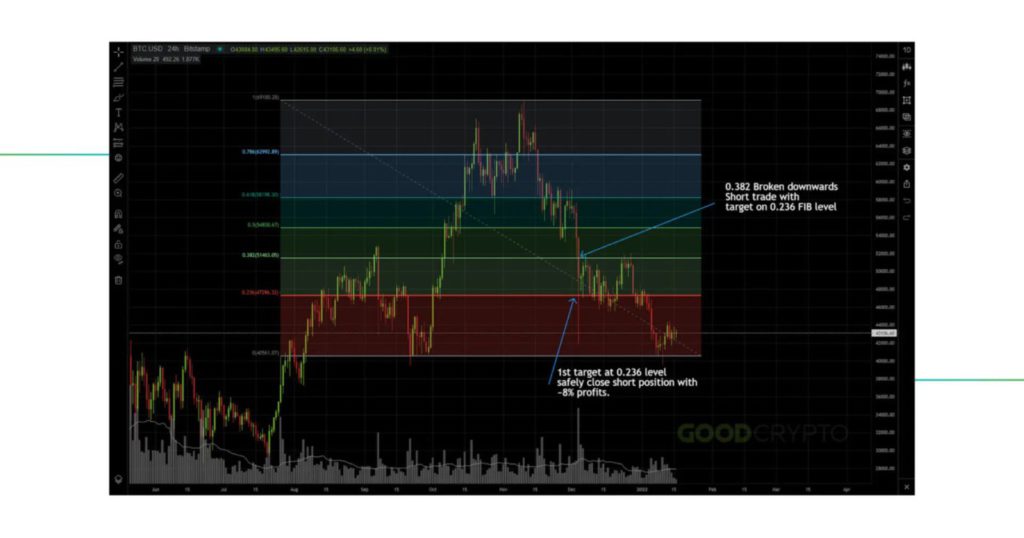
- Observe Retracement Levels: Watch how the price reacts at retracement levels such as 38.2%, 50%, and 61.8%. Price reactions at these levels can provide potential signals to enter or exit positions.Bitpanda+5TradingView+5Investopedia+5
- Combine with Other Indicators: Use other technical indicators such as RSI or MACD to confirm the signals given by Fibonacci retracement.
Practical Example
Suppose the price of Bitcoin rises from Rp500 million to Rp600 million. After reaching its peak, the price starts to correct. Using Fibonacci retracement, traders can identify the following levels:
- 23,6%: IDR 576,400,000
- 38,2%: IDR 561,800,000
- 50%: IDR 550,000,000
- 61,8%: IDR 538,200,000
If the price starts to show signs of reversal at the 61.8% level, traders may consider opening a buy position in the hope that the price will resume its uptrend.
Conclusion
Fibonacci retracement is a useful tool in technical analysis, especially in the volatile crypto market. By understanding and properly applying this concept, traders can increase their chances of making better trading decisions. However, it’s important to remember that no tool is perfect, and the use of Fibonacci retracement should be combined with other analysis and indicators for optimal results.
Also Read: SEC and Crypto Regulation: Between Stability and Innovation
That’s the latest information about crypto. Follow us on Google News for the latest crypto and blockchain technology updates. Enjoy an easy and secure crypto trading experience by downloading Pintu crypto app via Google Play Store or App Store now.
Experience web trading with advanced trading tools such as pro charting, various order types, and portfolio tracker only at Pintu Pro. Pintu Pro Futures is also available, where you can buy bitcoin leverage, trade btc futures, eth futures and sol futures easily from your desktop!
*Disclaimer
This content aims to enrich readers’ information. Pintu collects this information from various relevant sources and is not influenced by outside parties. Note that an asset’s past performance does not determine its projected future performance. Crypto trading activities are subject to high risk and volatility, always do your own research and use cold hard cash before investing. All activities of buying andselling Bitcoin and other crypto asset investments are the responsibility of the reader.
Reference:
- GoodCrypto. How to Trade with Fibonacci Retracement in Crypto. Accessed May 21, 2025.
- Featured Image: Pexels
Berita Terbaru
© 2026 PT Pintu Kemana Saja. All Rights Reserved.
Kegiatan perdagangan aset crypto dilakukan oleh PT Pintu Kemana Saja, suatu perusahaan Pedagang Aset Keuangan Digital yang berizin dan diawasi oleh Otoritas Jasa Keuangan serta merupakan anggota PT Central Finansial X (CFX) dan PT Kliring Komoditi Indonesia (KKI). Kegiatan perdagangan aset crypto adalah kegiatan berisiko tinggi. PT Pintu Kemana Saja tidak memberikan rekomendasi apa pun mengenai investasi dan/atau produk aset crypto. Pengguna wajib mempelajari secara hati-hati setiap hal yang berkaitan dengan perdagangan aset crypto (termasuk risiko terkait) dan penggunaan aplikasi. Semua keputusan perdagangan aset crypto dan/atau kontrak berjangka atas aset crypto merupakan keputusan mandiri pengguna.