Download Pintu App
Ethereum Price Crashes 9% Today (June 13): Is a Major Bear Market Move Coming?
Jakarta, Pintu News – Ethereum (ETH) is showing mixed signals as it moves near important technical zones, with traders closely watching for a possible breakout or breakdown.
On the one hand, the BBTrend indicator turned sharply bullish, jumping to 4.99 after being at -3 just a day earlier – signaling an increase in upward momentum.
But on the other hand, whale activity continued to decline for the seventh consecutive day, which could be a sign of weakening confidence from institutional players.
With ETH hovering between the strong resistance level of $2,900 and the important support level of $2,679, the next move is likely to determine the market direction in the short term.
Ethereum Price Drops 9.35% in 24 Hours
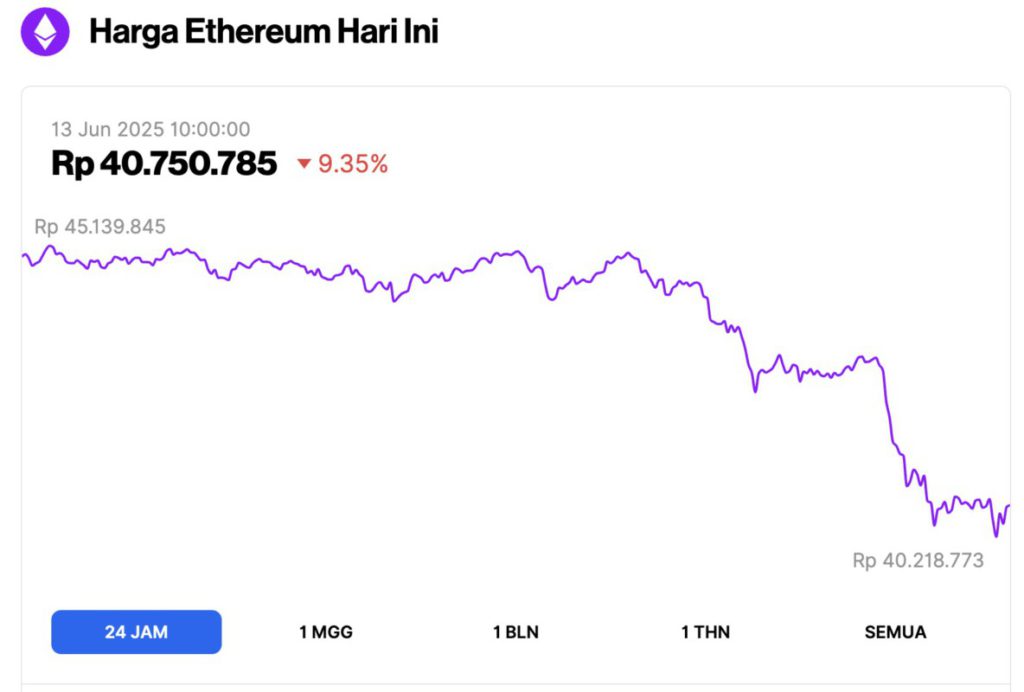
As of June 13, 2025, Ethereum (ETH) is trading at approximately $2,486, or around IDR 40,750,785 — marking a sharp 9.35% drop over the past 24 hours. Within this timeframe, ETH reached a high of IDR 45,139,845 and dipped to a low of IDR 40,218,773, reflecting significant intraday volatility.
At the time of writing, data from CoinMarketCap shows that Ethereum’s market capitalization stands at around $300.34 billion, with daily trading volume rising 20% to $34.28 billion within the last 24 hours.
Read also: Bitcoin Price Crashes to $103K — Is This the Bull Trap Everyone Feared?
BBTrend Ethereum Turns Bullish: What the 4.99 Number Means for Price Movement
Reporting from BeInCrypto (13/6), Ethereum’s BBTrend indicator jumped to 4.99, rising sharply in the last few hours after the previous day had touched negative -3.
This sudden change in momentum signals a possible reversal from bearish to bullish conditions, as the trend strength has now turned positive and is approaching the upper threshold that usually signals a potential breakout.
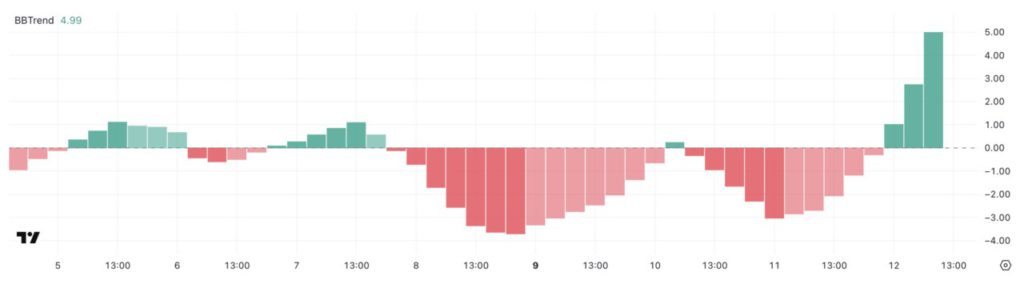
BBTrend, or Bollinger Band Trend, is an indicator that measures the strength of the direction of price movement relative to the Bollinger Bands. Values above 0 indicate the presence of upward momentum, while values below 0 indicate selling pressure or downward momentum.
The 4.99 figure reflects a strong bullish momentum. If this trend holds or continues to strengthen, it could signal further upside for ETH, as traders could interpret this movement as a change in market sentiment and repositioning of trading strategies.
ETH Whale Count Drops for 7 Consecutive Days: Bearish Signal in Sight?
The number of Ethereum whales – i.e. wallets holding between 1,000 and 10,000 ETH – has steadily decreased to 5,378, from 5,427 ten days ago and 5,400 three days ago.
This marks the seventh consecutive day of declines, which could reflect the cautious attitude of large holders, despite open interest in Ethereum futures recently hitting an all-time record high.
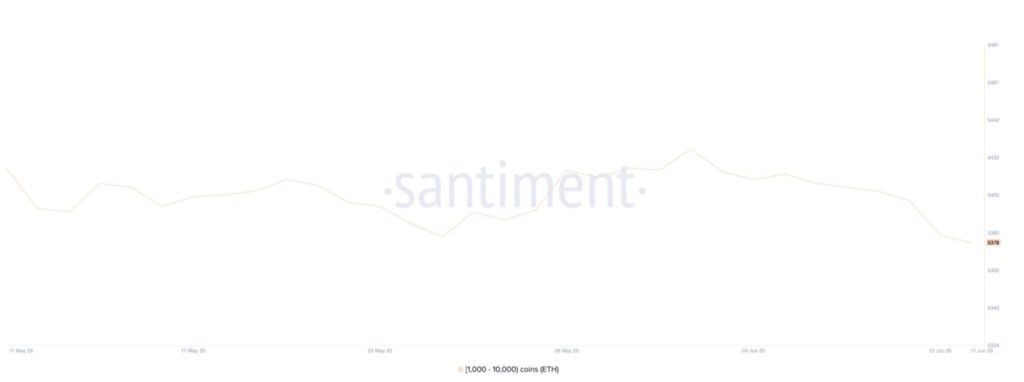
Whales are often regarded as an indicator of the sentiment of institutional investors or high-net-worth individuals, and a sustained decline in their numbers generally signals profit-taking, risk reduction, or weakening confidence in price movements in the short term.
Read also: 3 Cryptos to Buy After US CPI Data Slows and Inflation is Under Control!
Monitoring whale activity is essential as these large wallets have the power to influence market trends through their transaction volumes.
If the number of whales increases, this is usually interpreted as an accumulation phase, which can signal a strong belief in future price growth.
On the contrary, consistent declines like the ones happening now suggest that large holders may be selling some of their positions or choosing not to buy further.
This behavior could weaken price support levels and increase volatility. If this downward trend in whale numbers continues, ETH could face additional selling pressure and risk a broader market correction.
Ethereum Approaches Critical Support as $2,900 Resistance Still Holds
Ethereum recently failed to break the resistance level around $2,900 and has now started moving down, approaching the important support level of $2,679.
If this support is tested and unable to hold, the next downside target is in the range of $2,479 to $2,326, especially if bearish pressure continues to increase.
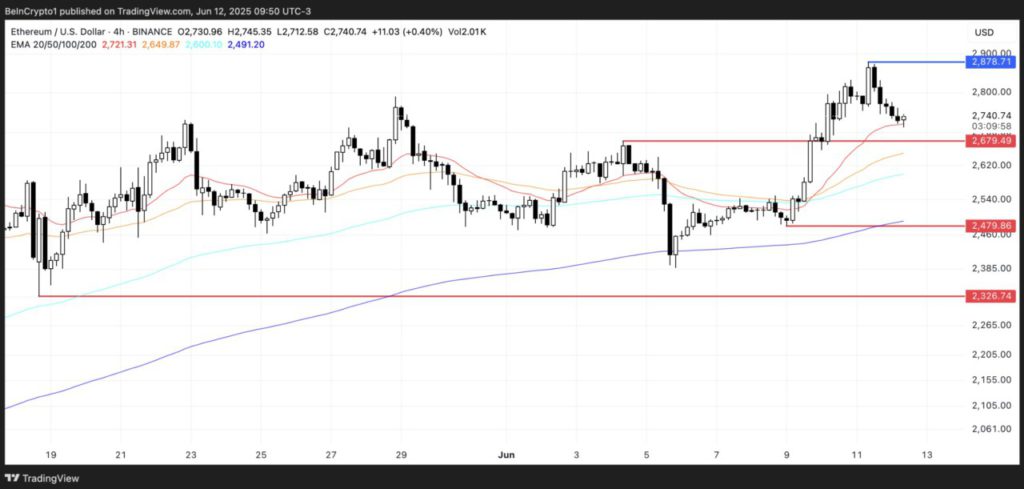
These levels are crucial, as a confirmed drop below them would indicate a change in the short-term market structure and could trigger further selling pressure.
With whale activity continuing to decline and market sentiment appearing cautious, Ethereum is now at a technical tipping point.
However, on the other hand, the BBTrend indicator shows a strongly bullish reversal, indicating that buying pressure may be starting to build up.
If Ethereum manages to regain its momentum and is able to break and turn the $2,900 level into strong support, then the potential for a rally to $3,000 is wide open – a level that was last reached on February 1.
Such a move would most likely reinforce bullish sentiment and draw interest back from traders who have been waiting on the sidelines.
However, for such a scenario to happen, the bullish side must first reclaim price strength and turn $2,900 into a solid support zone.
That’s the latest information about crypto. Follow us on Google News to stay up-to-date on the world of crypto and blockchain technology.
Enjoy an easy and secure crypto trading experience by downloading Pintu crypto app via Google Play Store or App Store now. Also, experience web trading with advanced trading tools such as pro charting, various types of order types, and portfolio tracker only at Pintu Pro. Pintu Pro Futures is also available, where you can buy bitcoin leverage, trade btc futures, eth futures and sol futures easily from your desktop!
*Disclaimer
This content aims to enrich readers’ information. Pintu collects this information from various relevant sources and is not influenced by outside parties. Note that an asset’s past performance does not determine its projected future performance. Crypto trading activities have high risk and volatility, always do your own research and use cold cash before investing. All activities of buying and selling bitcoin and other crypto asset investments are the responsibility of the reader.
Reference:
- BeInCrypto. Ethereum Price Faces Risk as Whale Activity Continues to Decline. Accessed on June 13, 2025
Berita Terbaru
© 2026 PT Pintu Kemana Saja. All Rights Reserved.
Kegiatan perdagangan aset crypto dilakukan oleh PT Pintu Kemana Saja, suatu perusahaan Pedagang Aset Keuangan Digital yang berizin dan diawasi oleh Otoritas Jasa Keuangan serta merupakan anggota PT Central Finansial X (CFX) dan PT Kliring Komoditi Indonesia (KKI). Kegiatan perdagangan aset crypto adalah kegiatan berisiko tinggi. PT Pintu Kemana Saja tidak memberikan rekomendasi apa pun mengenai investasi dan/atau produk aset crypto. Pengguna wajib mempelajari secara hati-hati setiap hal yang berkaitan dengan perdagangan aset crypto (termasuk risiko terkait) dan penggunaan aplikasi. Semua keputusan perdagangan aset crypto dan/atau kontrak berjangka atas aset crypto merupakan keputusan mandiri pengguna.