Download Pintu App
Dogecoin Price Increases Today (9/7/25): Crypto Analyst Reveals DOGE’s Path to $0.2596!
Jakarta, Pintu News – A market analyst said that the Dogecoin (DOGE) price path towards key resistance levels is open if it stays above support levels, with reference to technical indicators and momentum.
Dogecoin’s price chart shows a slow but steady recovery, accompanied by a consolidation phase. Over the past week, DOGE recorded a modest gain of about 2.8%.
Despite showing positive momentum, the price is still under resistance pressure at the $0.17 upper zone.
Dogecoin Price Rises 1.62% in 24 Hours
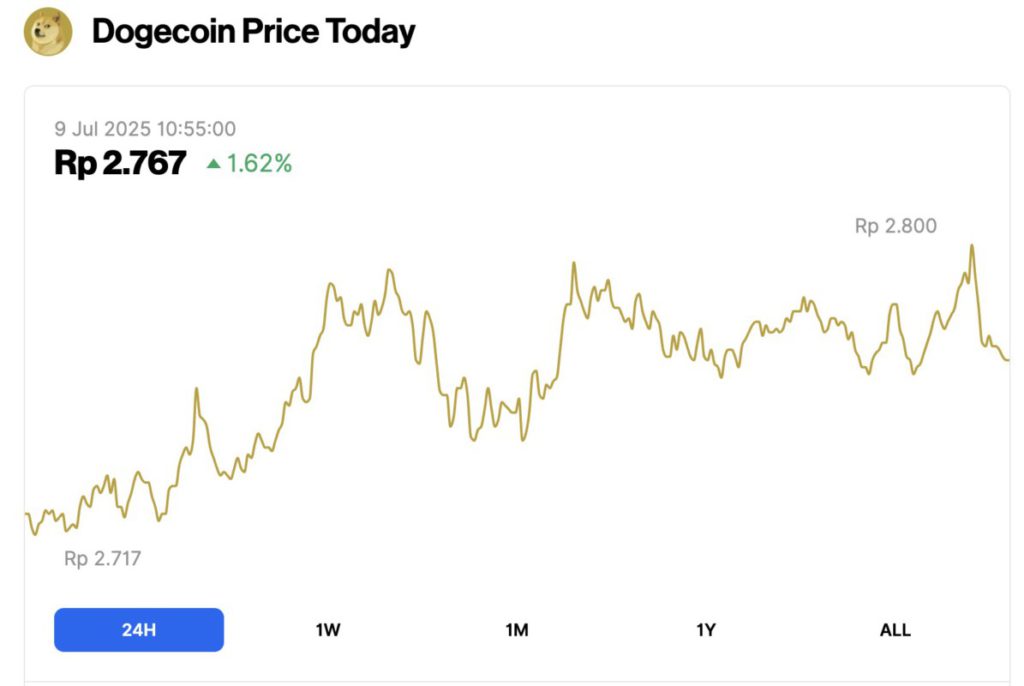
On July 9, 2025, Dogecoin saw a 1.62% gain over the past 24 hours, trading at $0.1704, which is equivalent to IDR 2,767. During the day, DOGE hit a low of IDR 2,717 and reached a high of IDR 2,800.
At the time of writing, Dogecoin’s market cap stands at around $25.56 billion, with trading volume dropping 28% to $819.4 million within 24 hours.
Read also: Ethereum Holds Firm at $2,500 — But On-Chain Data Reveals the Road to $5K Won’t Be Easy!
Dogecoin Price Forms a Double Bottom Pattern, Signaling a Potential Breakout
Meanwhile, analyst Tom Tucker has identified a classic technical pattern that could signal a bullish breakout. Based on the analysis he shared on platform X, the daily chart of DOGE/USDT shows the appearance of a double bottom formation.
This familiar trend reversal pattern formed near the strong support level at $0.1467-a zone where buyers have repeatedly entered.
This double bottom pattern involves two major low points. The first occurred on April 7, 2025, when the price dropped to $0.1299 before rebounding to $0.25. Meanwhile, the second low occurred on June 22, 2025, when the price touched $0.1437 and rebounded.
These two lows, which occurred around the same support zone, highlighted consistent buying interest and confirmed the importance of that support level. The neckline of this pattern is at $0.2596.
Strengthening Signals from RSI, MACD, and Whale Behavior
Several key momentum indicators support a bullish outlook and point to an improving market sentiment.
Specifically, the Relative Strength Index(RSI) has recovered above the 47 level and is now approaching the neutral 50 mark, indicating that the bearish pressure has weakened and momentum is starting to shift to the buyers’ side.
Meanwhile, the Moving Average Convergence Divergence(MACD) indicator shows a bullish crossover, where the MACD line moves above the signal line-which is usually interpreted as an early signal of upward momentum.

On the blockchain side, accumulation by whales has also increased, providing additional confirmation. In the past 30 days, large DOGE holders have increased their stake by 0.34%, while the stake held by small investors has decreased by 2.59%.
Read also: Dogecoin Price Prediction: Analysts Say DOGE Has the Potential to Surge to $3.40!
This change in ownership towards the whales is generally seen as a bullish indicator, as it shows that strong-handed parties are accumulating DOGE with the expectation of future gains.
Important Dogecoin Price Resistance Level Starts to Show
The price chart also includes Fibonacci retracement levels, which are drawn from Dogecoin’s macro low of $0.09242 to its highest peak of $0.48 last seen in December 2024.
These levels serve as a guide to identify crucial support and resistance zones. Currently, the Dogecoin price is trading slightly below the 0.786 Fibonacci level at $0.17640, which is now the immediate resistance.
The next resistance is around the neckline of the double bottom pattern at $0.2596, which is adjacent to the 0.618 Fibonacci level at $0.24233.
If the price is able to break out of this range, the next upside targets could include the Fib 0.5 level at $0.28864 and the 0.382 level at $0.33495-both of which are in the path of Dogecoin’s previous big rally.
According to Tucker, as long as the Dogecoin price remains above the key support level of $0.1467, the technical structure remains valid and the $0.2596 target is still open. From the current price of $0.1681, this would require a rally of approximately 54.45%.
URPD Chart Highlights Important Supply Zones
Meanwhile, an on-chain signal supporting the technical view comes from the UTXO Realized Price Distribution (URPD) chart by Glassnode.
This chart highlights the price levels where large volumes of DOGE last changed hands, helping to identify key resistance zones where holders may be looking to sell.
There are significant clusters at the levels of $0.1774, $0.2069, and $0.3622-zones also referred to as resistance areas by analyst Ali Martinez.
These zones have the potential to create selling pressure as the price approaches them. The largest accumulation was recorded at $0.0739, where 20.03% of DOGE’s supply was acquired. However, closer resistance exists at $0.177 (8.94% of supply) and $0.2069 (7.24%).
If the price manages to break above $0.21, the path to higher targets such as $0.36-where 3.82% of the last DOGE changed hands-will be further opened.
That’s the latest information about crypto. Follow us on Google News to stay up-to-date on the world of crypto and blockchain technology.
Enjoy an easy and secure crypto trading experience by downloading Pintu crypto app via Google Play Store or App Store now. Get a web trading experience with advanced trading tools such as pro charting, various types of order types, and portfolio tracker only at Pintu Pro. Pintu Pro Futures is also available, where you can buy bitcoin leverage, trade btc futures, eth futures and sol futures easily from your desktop!
*Disclaimer
This content aims to enrich readers’ information. Pintu collects this information from various relevant sources and is not influenced by outside parties. Note that an asset’s past performance does not determine its projected future performance. Crypto trading activities have high risk and volatility, always do your own research and use cold cash before investing. All activities of buying and selling bitcoin and other crypto asset investments are the responsibility of the reader.
Reference:
- Crypto Basic. Analyst Says Dogecoin Price Path to $0.2596 Open if It Holds This Level: Details. Accessed on July 9, 2025
Berita Terbaru
© 2026 PT Pintu Kemana Saja. All Rights Reserved.
Kegiatan perdagangan aset crypto dilakukan oleh PT Pintu Kemana Saja, suatu perusahaan Pedagang Aset Keuangan Digital yang berizin dan diawasi oleh Otoritas Jasa Keuangan serta merupakan anggota PT Central Finansial X (CFX) dan PT Kliring Komoditi Indonesia (KKI). Kegiatan perdagangan aset crypto adalah kegiatan berisiko tinggi. PT Pintu Kemana Saja tidak memberikan rekomendasi apa pun mengenai investasi dan/atau produk aset crypto. Pengguna wajib mempelajari secara hati-hati setiap hal yang berkaitan dengan perdagangan aset crypto (termasuk risiko terkait) dan penggunaan aplikasi. Semua keputusan perdagangan aset crypto dan/atau kontrak berjangka atas aset crypto merupakan keputusan mandiri pengguna.