Download Pintu App
5 Signals Ethereum (ETH) Has Reached the Bottom After Dropping 28 Percent?
Jakarta, Pintu News – The cryptocurrency market is buzzing again after a recent report suggested that Ethereum (ETH) may have entered the bottom zone after a decline of about 28 percent. The report utilizes on-chain and technical indicators to assess whether the selling pressure has been saturated so that ETH could enter a stabilization phase.
1. Selling pressure reaches peak according to on-chain data
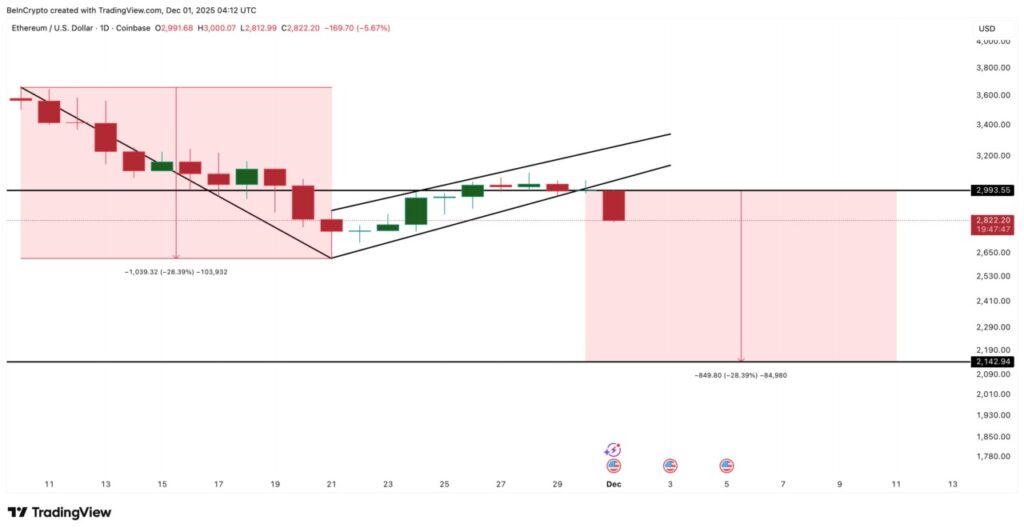
According to a report by BeinCrypto, a decline of around 28 percent in recent weeks has on-chain metrics such as exchange netflow, MVRV Ratio, and long-term holder activity showing a pattern of approaching oversold. The data highlights that the supply of ETH flowing into exchanges is starting to decline, an early sign that selling pressure is easing.
Analysts in the report noted that outflows from exchanges increased, which usually indicates that investors are choosing to hold assets rather than offload them to the market. This pattern is considered an important metric in detecting potential price bottom formation.
Also Read: 3 Stock Sectors Predicted to be Bought by Investors as the Technology Sector Weakens
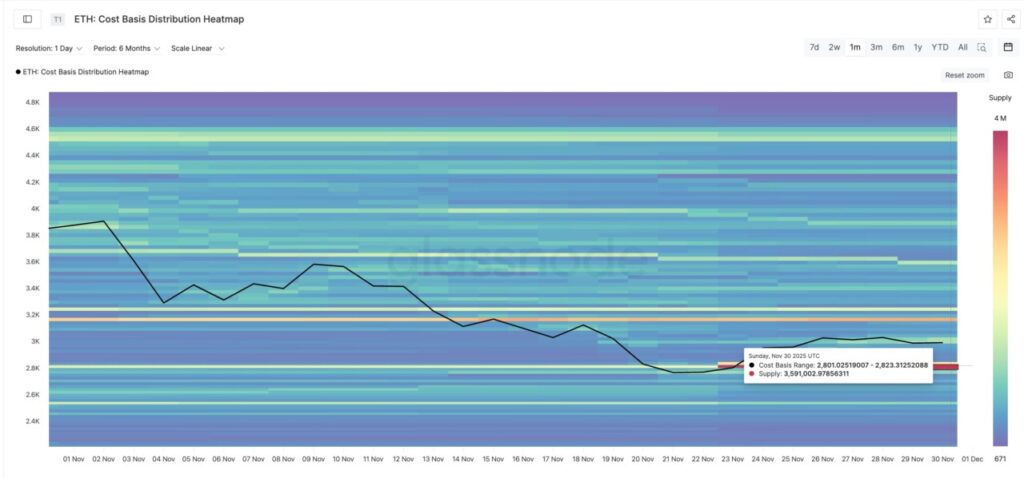
2. MVRV indicator indicates an undervalued position
The medium-term and short-term Market Value to Realized Value (MVRV) indicators for Ethereum are reportedly moving in the negative zone – a condition that historically often appears before price recovery. Based on this data, ETH is considered to be trading below its short-term fundamental value.
According to analysts cited in the report, the deep downward movement of MVRV in volatile periods usually follows an oversold phase, thus reinforcing the view that ETH may be entering a stabilization zone.
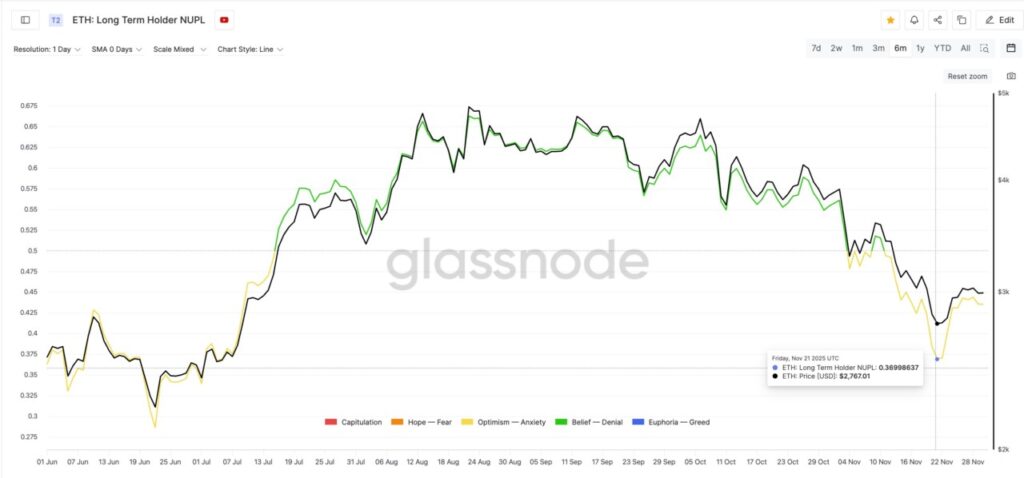
3. Long-term holder behavior shows accumulation
BeinCrypto reported that long-term holders showed a tendency to add to positions, rather than unwind them, amid the market downturn. This activity is considered a signal of long-term confidence in the Ethereum network.
Long-term holders are generally the “monitored” players as they are relatively unaffected by short-term volatility, so changes in their behavior may reflect deeper market structure.
4. Ethereum network activity remains stable
Despite ETH’s price drop, network activity data such as transaction volume, number of active addresses, and gas demand showed stability according to the report. This stability is an indicator that network usage is not contracting significantly.
In the context of a highly sentiment-driven crypto market, the stability of network activity often acts as a buffer against excessive selling pressure, providing an argument that network fundamentals remain strong despite price weakness.
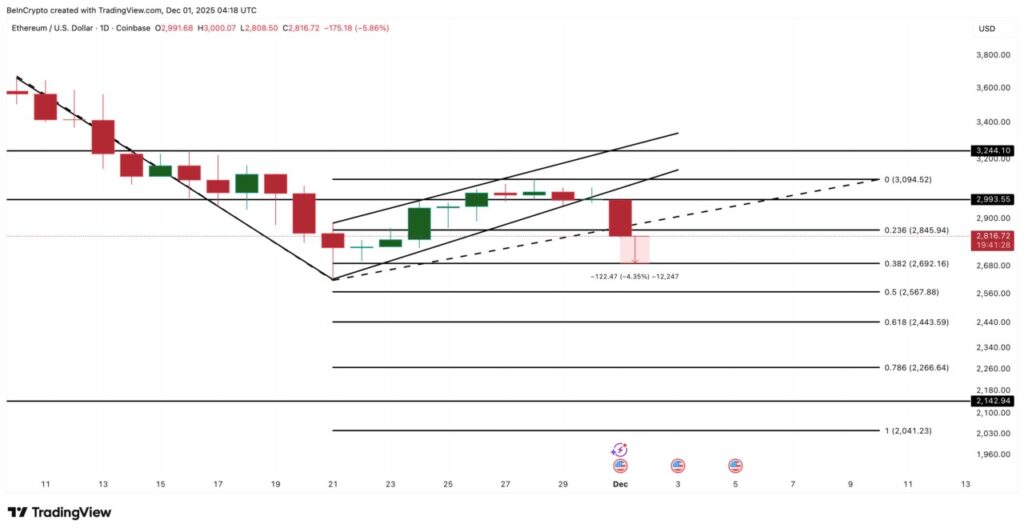
5. Risks remain: macro and liquidity uncertainties
While price floor signals are beginning to emerge, BeinCrypto also mentions that global macroeconomic risks, crypto market liquidity, as well as large-cap asset volatility could still delay the recovery. Therefore, the report emphasizes that the base signal should be read as a potential start, not a guarantee of a trend reversal.
According to the analyst, the market remains highly sensitive to macro developments such as monetary policy, inflation, as well as global equity market movements that could affect capital flows into riskier assets such as ETH.
FAQ
What causes price bottom signals to appear on Ethereum?
The bottom signal came about due to indicators such as negative MVRV, increasing exchange outflows, and long-term holder activity remaining stable.
Does this mean Ethereum price will rise in the near future?
There is no guaranteed upside; basic signals point to potential stabilization, but macro conditions and market liquidity remain risk factors.
Why are stock exchange outflows an important indicator?
Because when investors withdraw ETH from exchanges, they usually choose to keep it, which means less selling pressure.
Has Ethereum network activity been affected by the price drop?
According to reports, network activity such as transactions and active addresses remained stable, indicating that network fundamentals are not weakening.
What are the biggest risks to a potential ETH price recovery?
Risks include global macroeconomic pressures, crypto market volatility, and changes in investor sentiment towards risky assets.
Reference
- BeinCrypto. Ethereum Price 28% Bottom Signal. Accessed on December 2, 2025
Berita Terbaru
© 2026 PT Pintu Kemana Saja. All Rights Reserved.
Kegiatan perdagangan aset crypto dilakukan oleh PT Pintu Kemana Saja, suatu perusahaan Pedagang Aset Keuangan Digital yang berizin dan diawasi oleh Otoritas Jasa Keuangan serta merupakan anggota PT Central Finansial X (CFX) dan PT Kliring Komoditi Indonesia (KKI). Kegiatan perdagangan aset crypto adalah kegiatan berisiko tinggi. PT Pintu Kemana Saja tidak memberikan rekomendasi apa pun mengenai investasi dan/atau produk aset crypto. Pengguna wajib mempelajari secara hati-hati setiap hal yang berkaitan dengan perdagangan aset crypto (termasuk risiko terkait) dan penggunaan aplikasi. Semua keputusan perdagangan aset crypto dan/atau kontrak berjangka atas aset crypto merupakan keputusan mandiri pengguna.