Download Pintu App
7 Dogecoin (DOGE) Facts of the Week: Fractals, Price Action, RSI & Crypto Price Critical Zones
Jakarta, Pintu News – Dogecoin (DOGE), one of the most recognized cryptocurrencies in the global crypto market, is showing an interesting technical pattern on the weekly chart that is now being analyzed by market participants and technical observers.
These data and viewpoints provide insights into the structural dynamics of DOGE prices amid broader volatility in the current digital asset market. The data is derived from analyst reports and recent market movements released by market price watchers and sources.
1. Weekly Fractal Pattern Appears on the DOGE Chart
According to crypto analyst Cryptollica, Dogecoin’s weekly chart shows a fractal pattern similar to the historical accumulation phase before the big bull run in 2017 and 2021. He identified a four-point structure in the price movement history that is now back in view at the current 4th point, reflecting a long consolidation phase. This pattern suggests that the DOGE market has gone through a phase of low volatility with the formation of a stable price floor.
Fractal patterns like these attract attention because they don’t just show simple up or down trends, but repetitive structures that appear consistent over long-term price cycles. According to Cryptollica, this implies that periods of “market calm” could be distribution phases before major directional changes.
Also Read: 7 XRP vs BNB Facts: Tight Competition for Top-3 Market-Watched Crypto Positions
2. Weekly RSI Indicator Hints at Bottoming Points
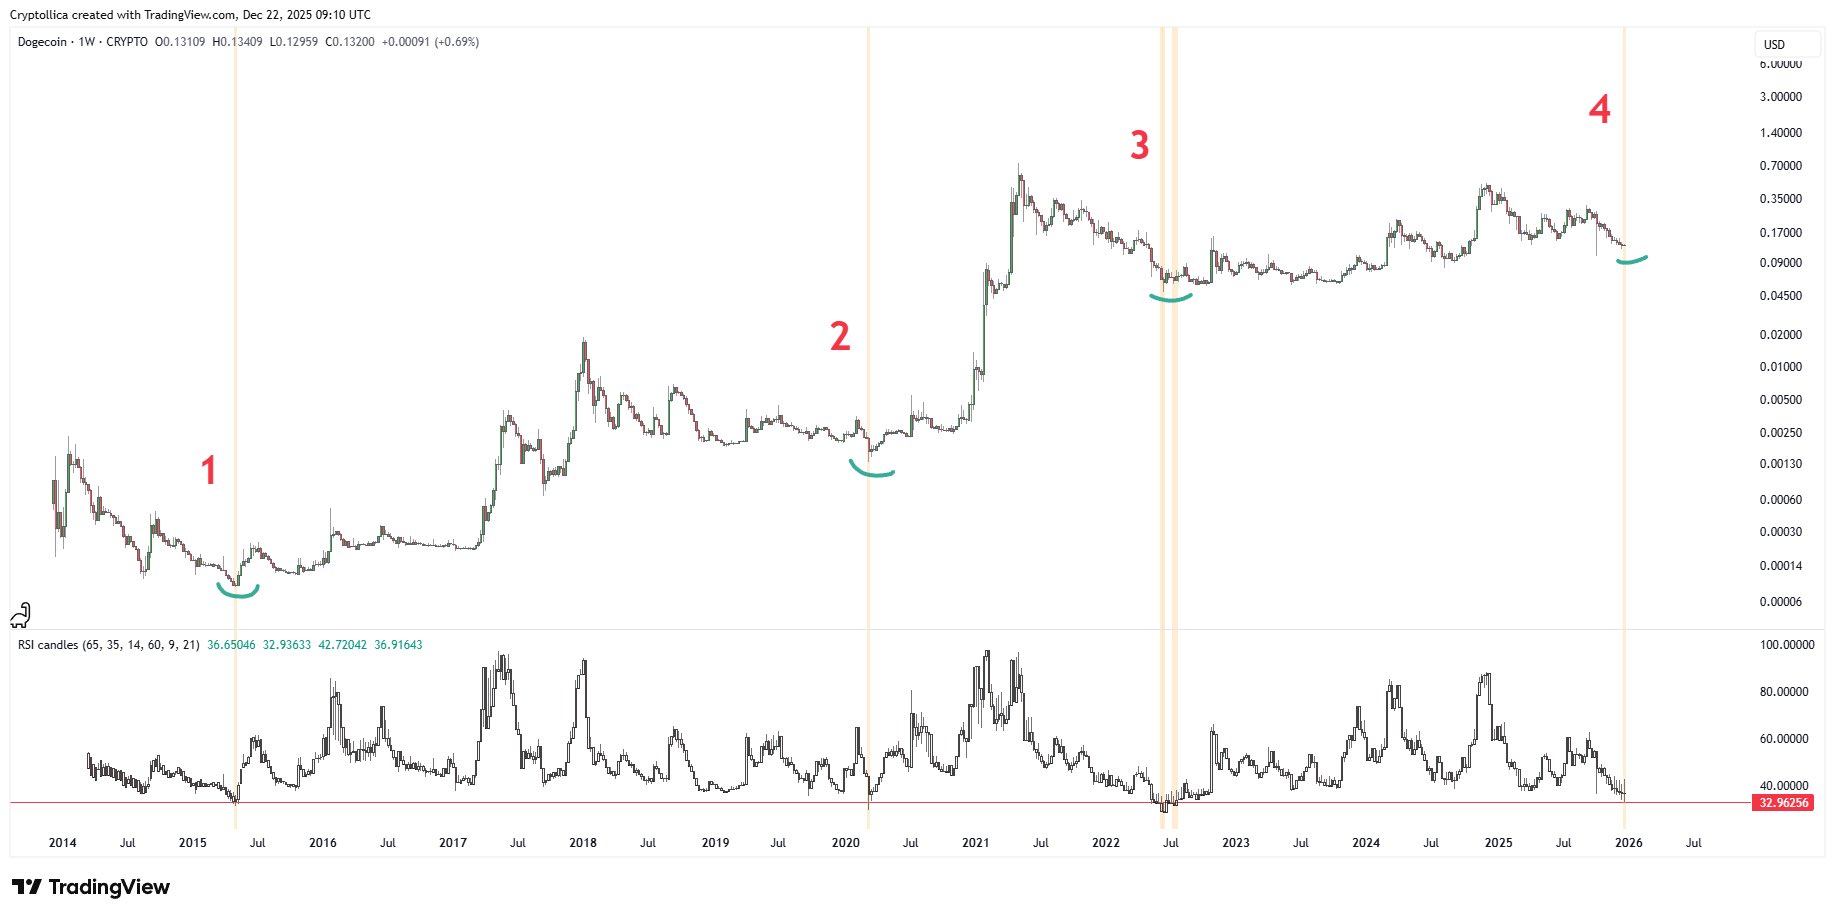
Cryptollica also highlighted the weekly Relative Strength Index (RSI) indicator which shows a baseline around the low-30 mark. In historical data, whenever the RSI reaches this area, the DOGE records a macro bottom and the selling momentum softens. The RSI returning to this level is considered by analysts to be a sign that the selling pressure has reached saturation point.
This phenomenon of the RSI stabilizing in the base area provides technical context on market momentum, as it is not just short-term price movements, but long-term cumulative momentum that indicates a potential trend change.
3. “Boring” Zone & Accumulation by Big Players
Analysis of the chart patterns shows that in the early phase (Zones 1 and 2), low volatility reflects a time when more patient investors began to accumulate DOGE, with smart money entering slowly. This phase is usually characterized by the market paying less attention to small price movements, but the underlying structure is forming significantly.
In this context, the “boredom phase” is not necessarily negative; on the contrary, it could indicate that the level of active market participation is decreasing while accumulation by investors with a long-term view is increasing.
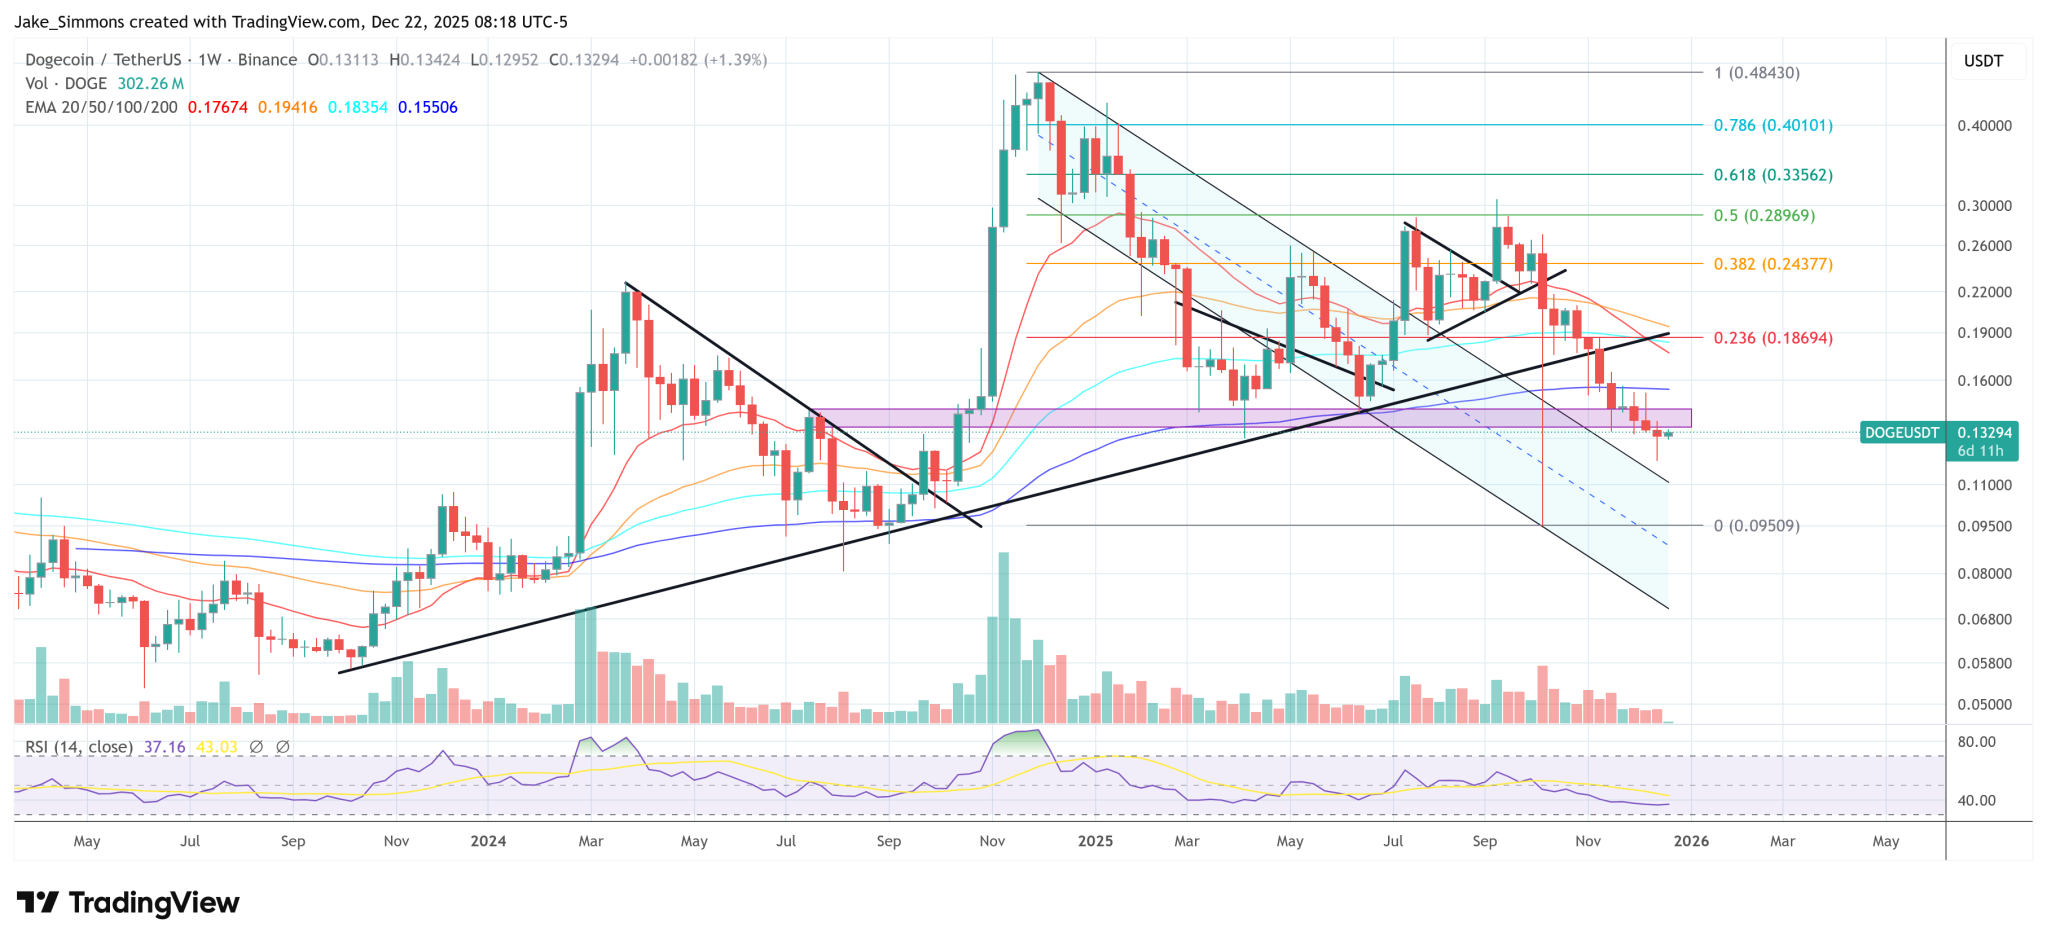
4. Current DOGE Price & Conversion to Rupiah
As of the last report, Dogecoin was trading at around $0.13294. With a conversion rate of $1 = Rp16,765, this price is equivalent to around Rp2,229 per DOGE. This value reflects the latest consolidation phase after volatile market movements over the past few weeks.
This price figure gives an idea of DOGE’s actuarial position in the context of the current market, even though the cryptocurrency market often moves dynamically on short timescales.
5. Broader Crypto Market Sentiment
The overall crypto market remains affected by several external factors such as the movement of Bitcoin (BTC) and the trend of institutional fund inflows in other digital assets. These macro pressures continue to affect the volatility of DOGE as well as other major digital assets in recent weeks.
The volatility of Bitcoin and other major altcoins often has an effect on memecoins such as DOGE, as the correlation between major market assets is often a parameter for liquidity sentiment and capital flows in cryptocurrencies.
6. Structural Risk & Historical Pattern Limitations
While fractal patterns and technical indicators provide insight, historical patterns do not necessarily guarantee identical results in the future. External factors such as macroeconomic conditions, changes in global market liquidity, and regulatory policies can significantly alter market dynamics.
It is important to note that technical analysis such as fractals are statistical tools, not exact predictions, so investors or market watchers should be aware of the limits of interpreting historical data in the context of highly volatile cryptocurrency price movements.
7. Next Directions Based on Fractals
According to Cryptollica, if the fractal pattern follows the previous trajectory (as it did in 2020-2021), the current phase will be the base before a potential larger move. However, this movement is not a guarantee, but rather a structural assumption that needs to be confirmed by further data.
This kind of interpretation gives an idea of how the cryptocurrency market may move in a broader scenario, but still requires confirmation from current price data, volume, and momentum indicators.
Follow us on Google News to get the latest information about crypto and blockchain technology. Check Bitcoin price today, Solana price today, Pepe coin and other crypto asset prices through Pintu Market.
Enjoy an easy and secure crypto trading experience by downloading Pintu crypto app via Google Play Store or App Store now. Also, get a web trading experience with various advanced trading tools such as pro charting, various types of order types, and portfolio tracker only at Pintu Pro.
*Disclaimer
This content aims to enrich readers’ information. Pintu collects this information from various relevant sources and is not influenced by outside parties. Note that an asset’s past performance does not determine its projected future performance. Crypto trading activities are subject to high risk and volatility, always do your own research and use cold hard cash before investing. All activities of buying andselling Bitcoin and other crypto asset investments are the responsibility of the reader.
FAQ
What is a fractal pattern on the Dogecoin chart?
Fractal patterns are repetitive price structures identified on Dogecoin’s weekly chart that are similar to historical phases before periods of large increases.
Who was the analyst who made this fractal observation?
This weekly fractal analysis of DOGE was posted by crypto analyst Cryptollica via the X platform.
What is the current price of DOGE according to reports?
The price of Dogecoin is reported to be around $0.13294, equivalent to around Rp2,229 per DOGE based on current exchange rates.
What does the low RSI indicator mean on the weekly chart?
The low RSI near 30 indicates that the momentum of the long-term selling pressure has weakened, as per DOGE’s historical archetype.
Do historical patterns guarantee future price movements?
No; historical patterns provide context but do not guarantee the direction or magnitude of future price movements.
Reference:
Jake Simmons/NewsBTC. Dogecoin Weekly Fractal Hints At A Bigger Move Brewing. Accessed December 23, 2025.
Berita Terbaru
© 2026 PT Pintu Kemana Saja. All Rights Reserved.
Kegiatan perdagangan aset crypto dilakukan oleh PT Pintu Kemana Saja, suatu perusahaan Pedagang Aset Keuangan Digital yang berizin dan diawasi oleh Otoritas Jasa Keuangan serta merupakan anggota PT Central Finansial X (CFX) dan PT Kliring Komoditi Indonesia (KKI). Kegiatan perdagangan aset crypto adalah kegiatan berisiko tinggi. PT Pintu Kemana Saja tidak memberikan rekomendasi apa pun mengenai investasi dan/atau produk aset crypto. Pengguna wajib mempelajari secara hati-hati setiap hal yang berkaitan dengan perdagangan aset crypto (termasuk risiko terkait) dan penggunaan aplikasi. Semua keputusan perdagangan aset crypto dan/atau kontrak berjangka atas aset crypto merupakan keputusan mandiri pengguna.


