Download Pintu App
XAU/USD Analysis and Predictions Today February 10, 2026
Jakarta, Pintu News – The XAU/USD (gold against USD) pair is the main focus of the commodity market on February 10, 2026 trading, with high volatility influenced by US macro data and dollar movements. The latest technical analysis shows that the price dynamics of XAU/USD still depends on the market’s reaction to global sentiment and fundamental pressure on the dollar. This daily forecast provides a technical overview and outlook for price movements that are relevant for commodity traders and investors.
XAU/USD Current General Technical Analysis
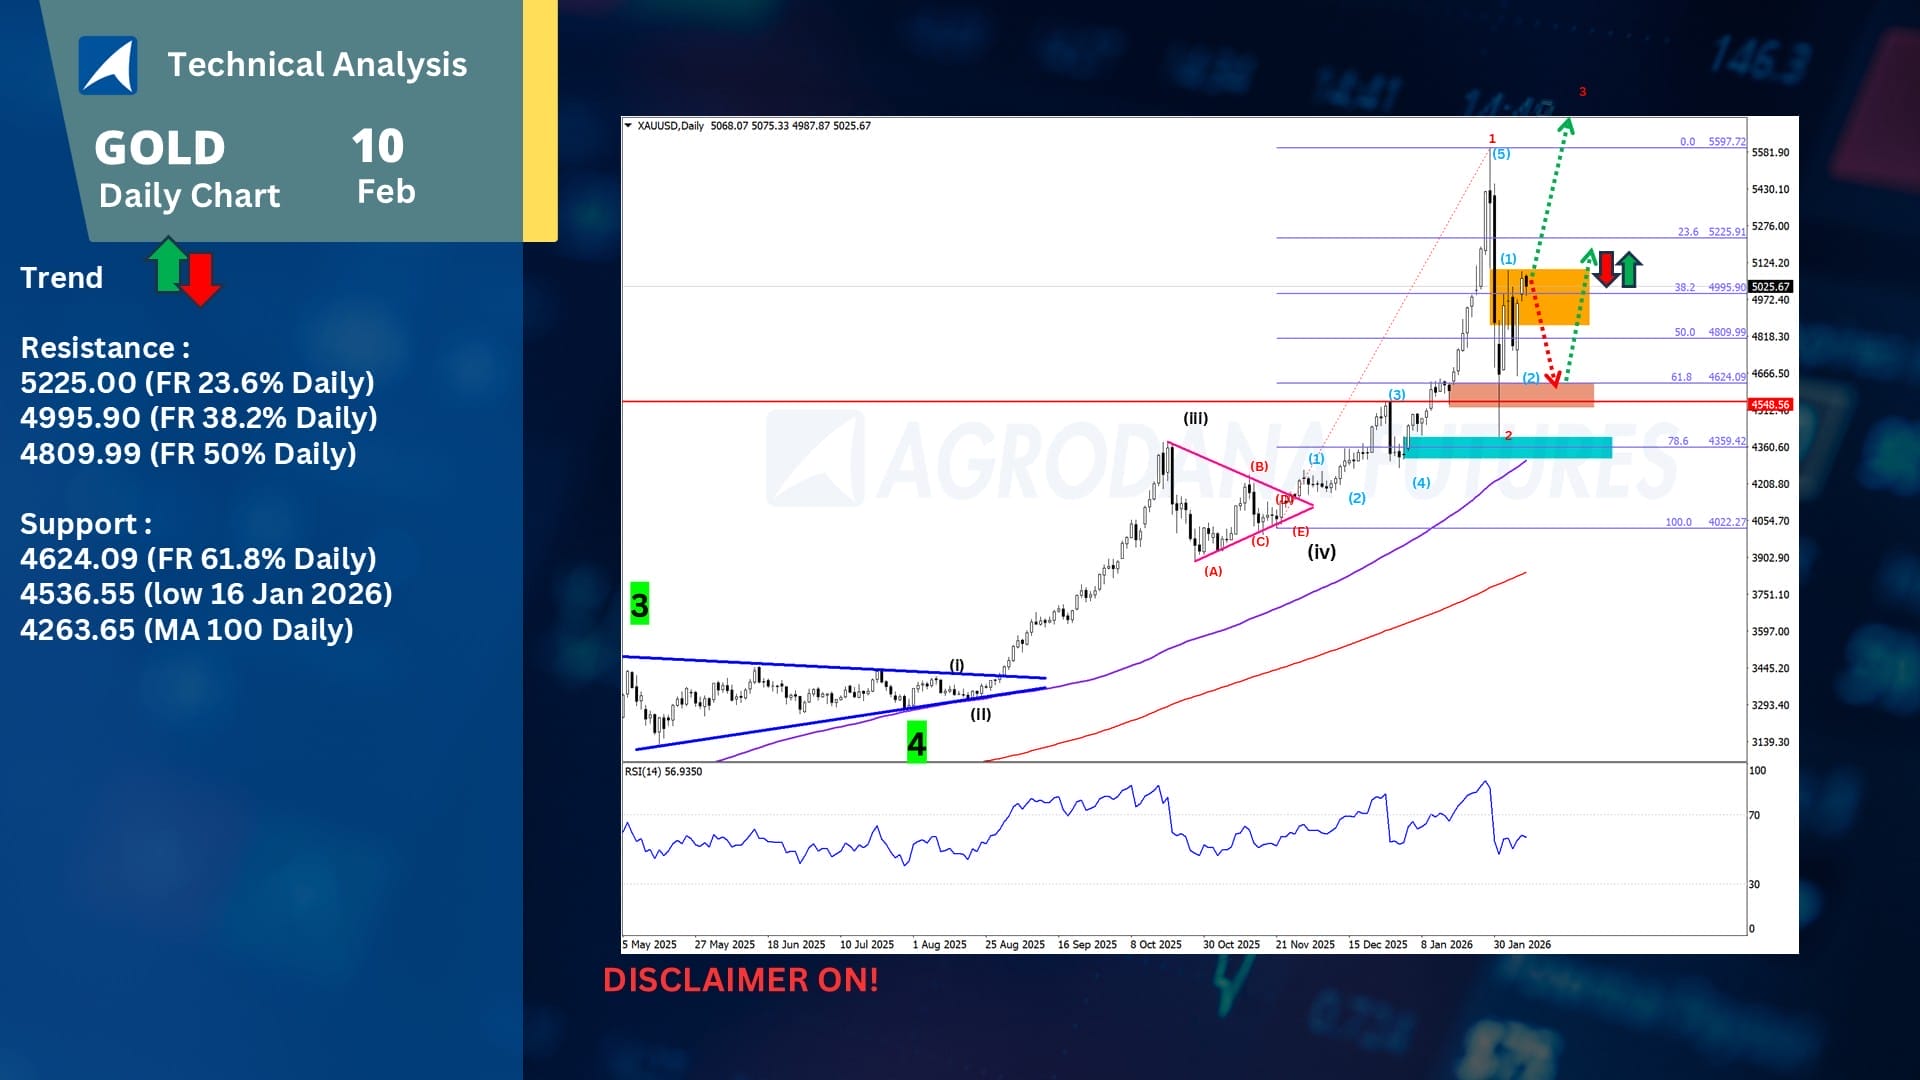
Gold price movement (XAU/USD) in this period is expected to remain in a consolidation range after rebounding from significant support levels. According to the latest daily forecast, the price of gold is currently trading in the range of around US$5 029 per ounce, and further movement may occur in the range between US$4 937-US$5 153. This range reflects the buying and selling pressure holding each other back in the short term.
Other technicals show that on the daily chart, gold is in a region that still shows a price recovery phase, but a significant breakout above the resistance level could be a bull catalyst. Conversely, if the price breaks below the so-called support zone, it will open up sharper bearish opportunities. This pattern corresponds to the character of market consolidation in the phase of waiting for the release of important economic data.
Also Read: 7 Impacts of Japan’s Political Victory on BTC & Gold Prices
Important Support and Resistance to Watch
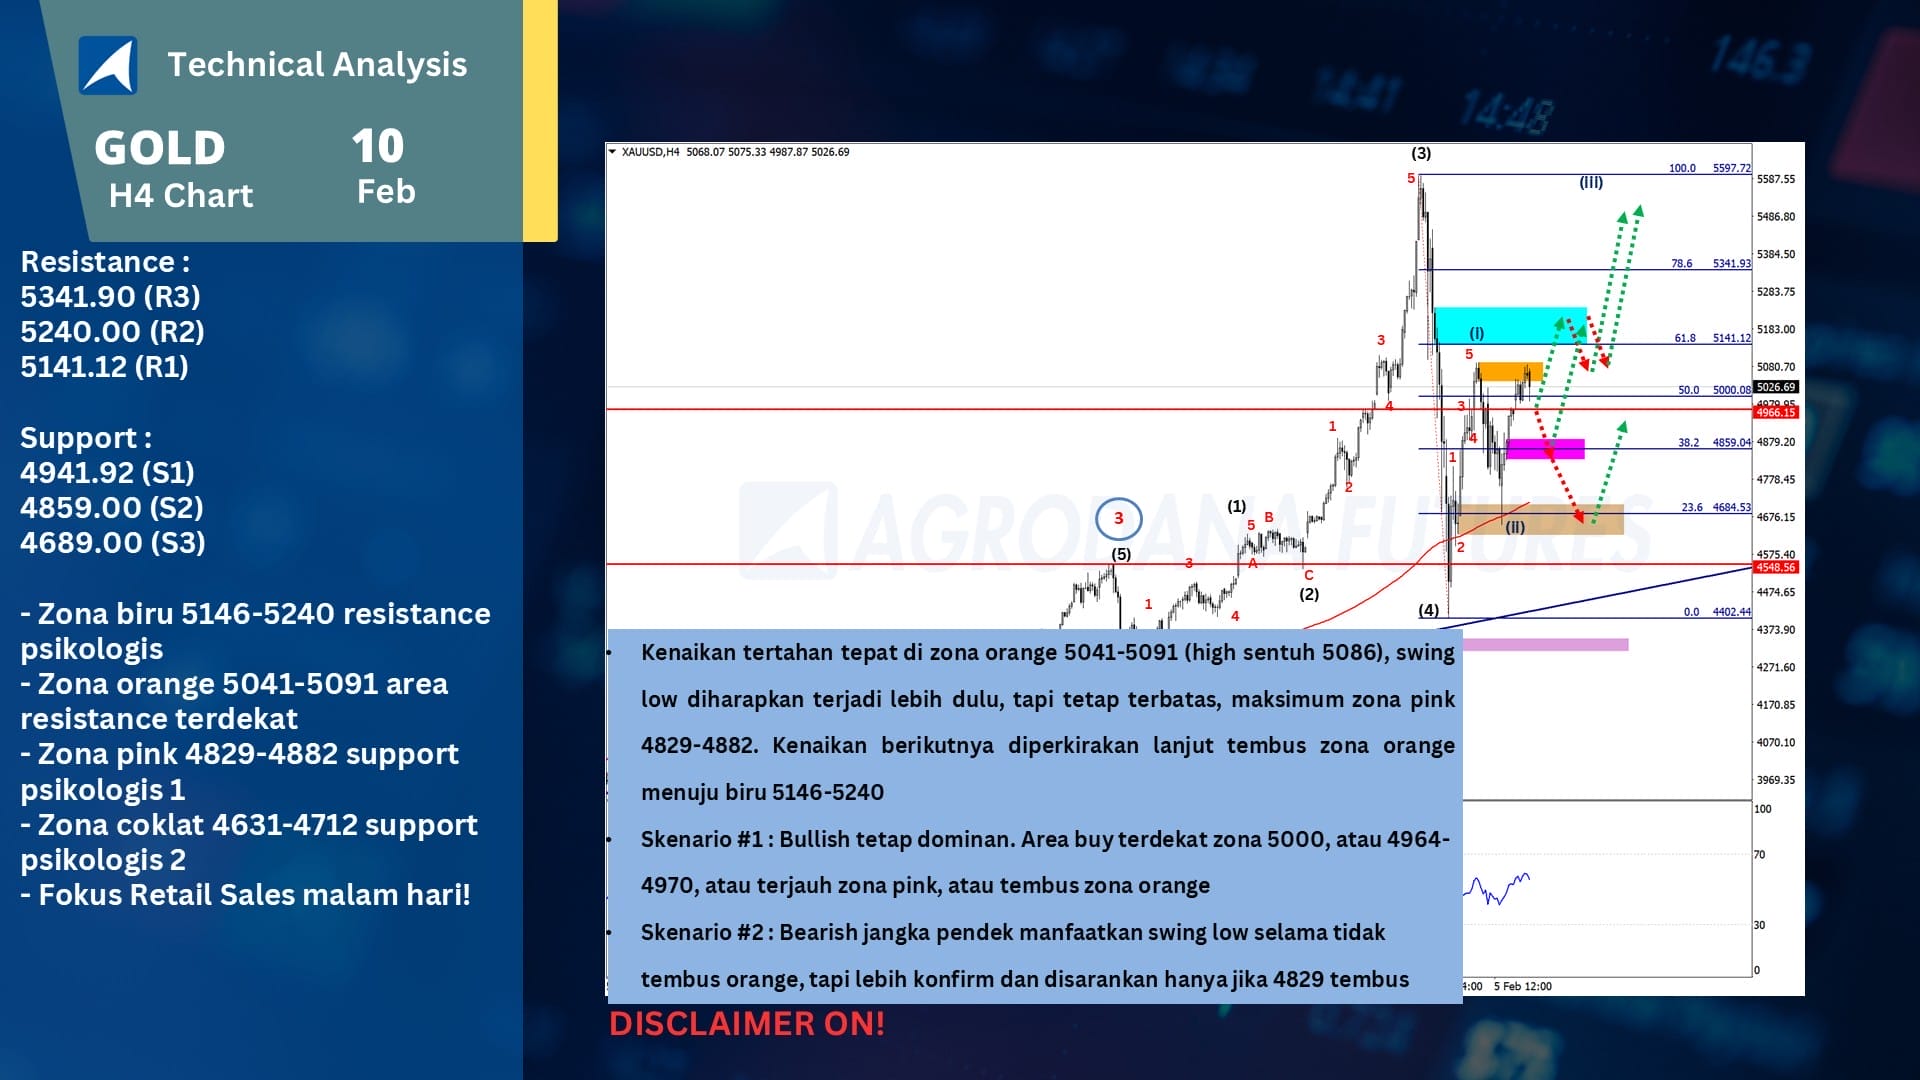
On the technical chart, the main resistance level to watch is above the US$5 080-US$5 100 zone, which previously held the XAU/USD price up. If the price is able to break this level with strong volume, then the short-term bullish bias could strengthen and open up space towards the next resistance level.
On the other hand, significant support is in the region around US$4 900-US$4 940. If XAU/USD fails to defend this level, it’s likely that the price will move down further. A breakdown below this support could trigger additional selling pressure, especially if the US dollar strengthens again.
Technical Indicators: Daily Bias
Based on observations of short-term chart indicators, bullish momentum is maintained as long as gold prices stay above important moving averages such as MA 10 or MA 20 on the daily chart. This suggests that buyer sentiment is still active and capable of pushing prices to test major resistance. However, until a confirmation breakout occurs, XAU/USD tends to move in a sideways (consolidation) pattern.
RSI levels or other momentum indicators on the daily chart also indicate that gold has not reached extreme overbought conditions. This opens up additional upside opportunities if risk capital flows increase and the dollar weakens. Observing the confirmation of these signals helps traders determine more measured entries and exits.
Fundamental Factors Affecting Today’s Price
Besides technicals, the price of XAU/USD today is influenced by the release of important economic data such as the inflation index and statements from US Federal Reserve officials. Stronger than expected economic data tends to strengthen the US dollar and put pressure on gold prices, while weak data provides an impetus for XAU/USD to rise. Geopolitical sentiment also remains a factor that can increase demand for safe-havens like gold.
Market reactions to fundamental data often bring high volatility to the XAU/USD pair. Traders are advised to monitor these macro data releases in real-time to adjust day trading strategies, especially in case of sharp movements that have not been predicted by technical indicators.
XAU/USD Movement Prediction Today
On a daily outlook, XAU/USD is expected to move within a range of US$4 950-US$5 150 with a sideways to bullish bias if prices hold above important support. A breakout above US$5 100 resistance could be a further signal towards a test of this week’s high, while a break below key support opens the door for a further correction.
Day traders and commodity investors are advised to watch for breakout confirmations as well as economic data releases that could catalyze gold price volatility. Risk management remains important as XAU/USD is still showing wide fluctuations amid dynamic market sentiment.
Also Read: 5 Facts Robert Kiyosaki is Ready to Buy Bitcoin if it Falls to the Level of IDR101 Million
Follow us on Google News to stay up to date with the latest crypto and blockchain technology. Check Bitcoin price, USDT to IDR and Nvidia stock price tokenized via Pintu Market.
Enjoy an easy and secure crypto trading experience by downloading the Pintu crypto app via Play Store or App Store now. Also, experience web trading with advanced trading tools such as pro charting, various order types, and portfolio tracker only at Pintu Pro.
*Disclaimer
This content aims to enrich readers’ information. Pintu collects this information from various relevant sources and is not influenced by outside parties. Note that an asset’s past performance does not determine its projected future performance. Crypto trading activities are subject to high risk and volatility, always do your own research and use cold hard cash before investing. All activities of buying and selling Bitcoin and other crypto asset investments are the responsibility of the reader.
Reference
- Agrodana Futures. Technical Analysis Forex, Gold (XAUUSD) February 10, 2026. Accessed February 10, 2026.
Berita Terbaru
© 2026 PT Pintu Kemana Saja. All Rights Reserved.
Kegiatan perdagangan aset crypto dilakukan oleh PT Pintu Kemana Saja, suatu perusahaan Pedagang Aset Keuangan Digital yang berizin dan diawasi oleh Otoritas Jasa Keuangan serta merupakan anggota PT Central Finansial X (CFX) dan PT Kliring Komoditi Indonesia (KKI). Kegiatan perdagangan aset crypto adalah kegiatan berisiko tinggi. PT Pintu Kemana Saja tidak memberikan rekomendasi apa pun mengenai investasi dan/atau produk aset crypto. Pengguna wajib mempelajari secara hati-hati setiap hal yang berkaitan dengan perdagangan aset crypto (termasuk risiko terkait) dan penggunaan aplikasi. Semua keputusan perdagangan aset crypto dan/atau kontrak berjangka atas aset crypto merupakan keputusan mandiri pengguna.