Download Pintu App
Gold Price Prediction 2026: How High Can Gold Go?
Jakarta, Pintu News – The price of gold in 2026 is already providing drama that no other commodity has seen in a decade. Last month, bullion broke the $5,000 level for the first time in history, then continued to soar to $5,595 per ounce (Rp94,410,030).
But after that, the price plummeted by almost $1,200 (IDR 20,248,800) in just two days-the worst two-day drop since 1983. However, the big commodity desks on Wall Street have been fairly calm, with many even opting to raise their gold price projections.
Gold Price Prediction 2026 According to Reuters Survey
A Reuters survey of 30 analysts and traders now puts the median 2026 gold price forecast at $4,746.50 per troy ounce (IDR 80,091,661)-the highest annual consensus figure in Reuters’ polling history since 2012.
Read also: What are Gold Studs?
Interestingly, the same survey a year ago still projected gold prices this year at around $2,700. The huge difference between the two figures shows how quickly the global situation is changing.
“We are entering a phase when the legitimacy and durability of institutions and systems that have for decades underpinned global economic and geopolitical stability are being tested in a way not seen in a generation,” said David Russell, CEO of precious metals dealer GoldCore.
That may sound like an exaggeration-until you look at the gold price movement chart yourself.
Gold Price Predictions 2026: What the Big Banks Expect
How high can the gold price go by 2026? The range of projections from financial institutions is quite wide – and the upper limits of these estimates have recently been rising rapidly.
| Institution | Gold Price Projections 2026 | Key Drivers |
|---|---|---|
| TD Securities | Quarterly average $5,000 (IDR 84,370,000); peak potential $5,455-$5,700 (IDR 92,052,670-Rp96,151,800) | US dollar weakness, potential Fed policy changes |
| JPMorgan | $5,000 (Rp84,370,000) in Q4 2026; $6,000 (Rp101,244,000) long-term | 800 tons purchased by the central bank |
| Goldman Sachs | $5,400 (Rp91,119,600) (revised up from $4,900 / Rp82,682,600) | De-dollarization, inflation |
| Reuters Survey Median | Annual average $4,746.50 (IDR 80,091,661) | Geopolitical risks, safe haven assets |
| Deutsche Bank | Positive outlook; no change to the lower bound of the projection | Rational investor allocation |
| Yardeni Research | $6,000 (IDR101,244,000) in 2026 | Macroeconomic uncertainty |
Bart Melek, Managing Director and Head of Commodity Strategy at TD Securities-one of the most respected voices in the commodity market-says it straight:
“Fundamentally, my team and I still like gold at current levels.” His base scenario puts the quarterly average at around $5,000, with a technical “ceiling” of $5,455. He also does not rule out the possibility of gold touching $5,700, given that the market is entering a phase of high volatility.
Read also: Peter Brandt’s Prediction: Bitcoin Ready to Rebound, Gold Threatened to Lose $4,000!
Technical Analysis of Gold Price: Signals from the Chart
If you look at the gold price chart, the uptrend formed in the past two years still remains structurally intact. Based on a reading of the chart, a correction of around $1,000 from the January 29 peak is still considered a healthy pullback, considering that the previous rally was very fast-gold shot from around $4,300 (IDR 72,558,200) to almost $5,600 (IDR 94,494,400) in just a matter of weeks.
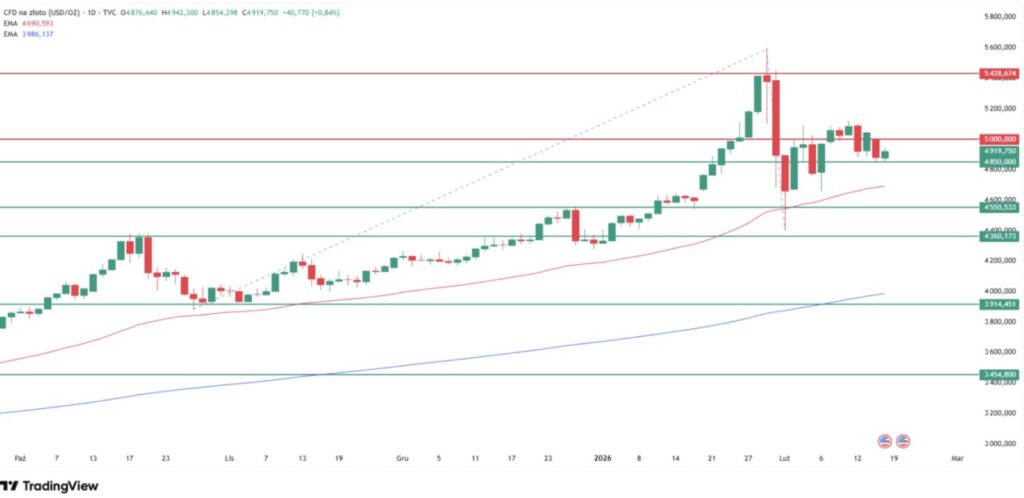
From the chart analysis, gold is currently forming a consolidation phase with fairly clear boundaries:
- Lower support: $4,550 (IDR76,776,700) – the late December peak area that was retested as support during the January-February selling pressure. This level held at closing price and is still the main “floor” of the current range.
- Upper resistance: $5,420 (IDR91,457,080) – the January 28 closing peak that held the upside, although prices briefly touched $5,600 (IDR94,494,400) intraday on January 29.
- Intermediate support: $4,850 (IDR81,838,900) – now serves as a local pivot point and the first line of defense if selling pressure appears again.
- Psychological resistance: $5,000 (IDR84,370,000) – a level that needs to be convincingly recaptured to restore broader bullish momentum.
- February’s local peak: around $5,100 (IDR86,057,400) – the next important threshold before a retest of the All-Time High is again plausible.
- 50-period EMA: around $4,700 (IDR 79,307,800) – an exponential moving average that could potentially be a bounce area if a deeper correction occurs.
In essence, according to technical analysis, the current gold price tends to move sideways in the range of $4,550-$5,420 (IDR76.78 million-IDR91.46 million). As long as it is within this range, daily movements can be considered “noise”. What is more decisive for the next direction is which level is broken first.
On the downside, if prices drop and stay below $4,550 (IDR76,776,700), attention will turn to the more crucial zone around $4,000 (IDR67,496,000)-the area where the 200-day MA is adjacent to the November 2025 low.
If there is a confirmed weekly close below that area, it could be a strong signal that gold’s multi-year bullish trend is starting to lose steam. As long as it hasn’t happened yet, the uptrend is still worth giving room for.
Follow us on target="_blank" rel="noreferrer noopener" href="https://news.google.com/u/2/publications/CAAqBwgKMKXoywsw1YPjAw?hl=id&gl=ID&ceid=ID%3Aid">Google News to stay up to date with the latest in crypto and blockchain technology. Check Bitcoin price, usdt to idr and tokenized nvidia stock price via Pintu Market.
Enjoy an easy and secure crypto trading and crypto gold investment experience by downloading the Pintu crypto app via Play Store or App Store now. Also, experience web trading with advanced trading tools such as pro charting, various order types, and portfolio tracker only at Pintu Pro.
*Disclaimer
This content aims to enrich readers’ information. Pintu collects this information from various relevant sources and is not influenced by outside parties. Note that an asset’s past performance does not determine its projected future performance. Crypto trading activities are subject to high risk and volatility, always do your own research and use cold hard cash before investing. All activities of buying and selling Bitcoin and other crypto asset investments are the responsibility of the reader.
Reference:
- Finance Magnets. Gold Price Prediction 2026: How High Can Gold Really Go? Accessed on February 20, 2026
Berita Terbaru
© 2026 PT Pintu Kemana Saja. All Rights Reserved.
Kegiatan perdagangan aset crypto dilakukan oleh PT Pintu Kemana Saja, suatu perusahaan Pedagang Aset Keuangan Digital yang berizin dan diawasi oleh Otoritas Jasa Keuangan serta merupakan anggota PT Central Finansial X (CFX) dan PT Kliring Komoditi Indonesia (KKI). Kegiatan perdagangan aset crypto adalah kegiatan berisiko tinggi. PT Pintu Kemana Saja tidak memberikan rekomendasi apa pun mengenai investasi dan/atau produk aset crypto. Pengguna wajib mempelajari secara hati-hati setiap hal yang berkaitan dengan perdagangan aset crypto (termasuk risiko terkait) dan penggunaan aplikasi. Semua keputusan perdagangan aset crypto dan/atau kontrak berjangka atas aset crypto merupakan keputusan mandiri pengguna.