Download Pintu App
Bitcoin Price Weakens to $70,000 Today: What Will Happen Next?
Jakarta, Pintu News – Bitcoin (BTC) has fallen through the psychologically important level of $70,000, after dropping more than $5,000 on March 19, 2026 and erasing the gains it had made earlier. This sharp move came as a surprise to many market participants.
Bitcoin’s decline this time wasn’t caused by one single catalyst. Rather, a combination of macroeconomic pressures are affecting global risk appetite and driving a change in market sentiment.
Then, how will the Bitcoin price move today?
Bitcoin Price Drops 0.65% in 24 Hours
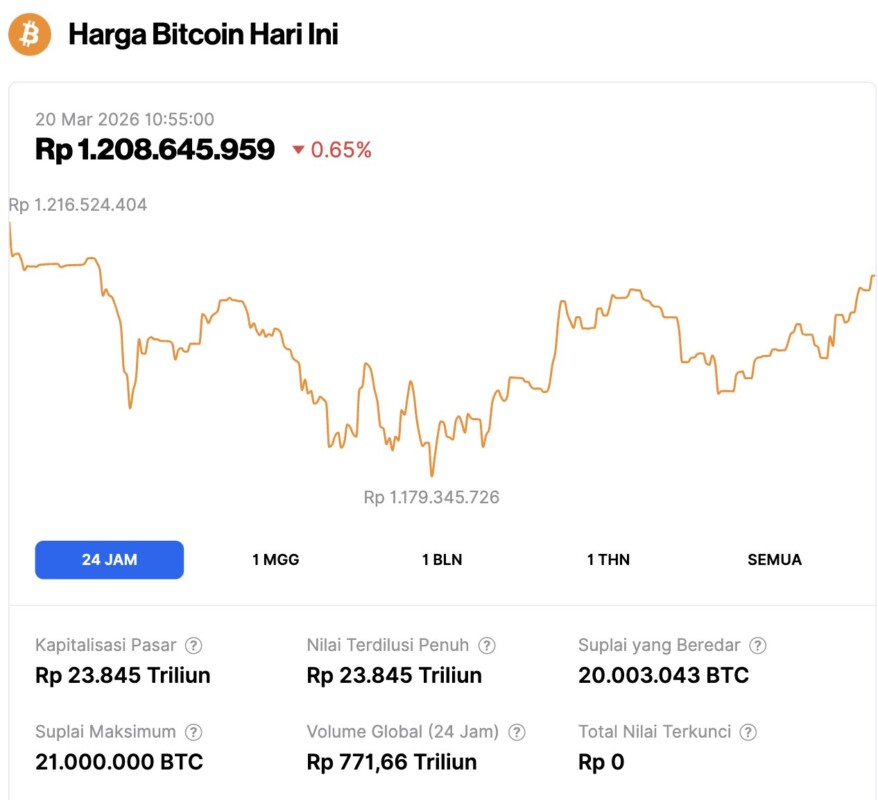
As of March 20, 2026, Bitcoin was trading at $70,733, or around IDR 1,208,645,959, after posting a 0.65% decline over the past 24 hours. Within the same period, BTC fell to a low of IDR 1,179,345,726 and climbed to a high of IDR 1,216,524,404.
At the time of writing, Bitcoin’s market capitalization stood at approximately IDR 23,845 trillion, while its 24-hour trading volume slipped 2% to IDR 771.66 trillion.
Read also: Pepe Coin Price Jumps 20%, How High Can PEPE Fly in March?
Bitcoin sell-off triggered by macro factors, not crypto-specific events
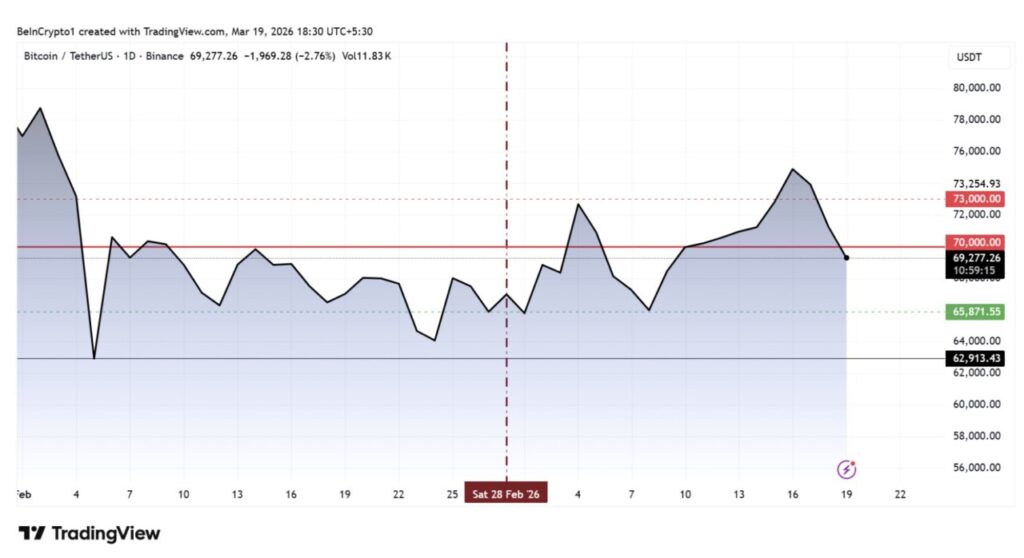
As of March 19, 2026, Bitcoin was trading at $69,913, down nearly 5% in the last 24 hours and back to the price area last seen over a week ago. Unlike previous corrections that are usually triggered by internal factors within the crypto industry, this time the weakness is more reflective of broader pressures in the global market. In particular, it was influenced by:
- rising inflation
- delayed interest rate cuts, and
- increasingly tight liquidity.
All of these factors have prompted investors to review their risk exposure, while also explaining why BTC failed to hold above $70,000 before resuming its next potential rise. Amid central banks’ stance of keeping interest rates high for longer, capital flows tend to exit speculative assets and move into instruments that are considered safer, such as bonds and cash.
Historically, this situation has tended to be unfavorable for Bitcoin, as the asset generally performs better when there is more liquidity in the market.
Energy Crisis Triggers Price Adjustments in Global Markets
One of the main triggers for this wave of selling is the worsening energy shocks in the Middle East. Disruptions around the Strait of Hormuz have reportedly hampered much of the global oil supply, triggering what analysts are calling one of the most serious supply shocks in modern history.
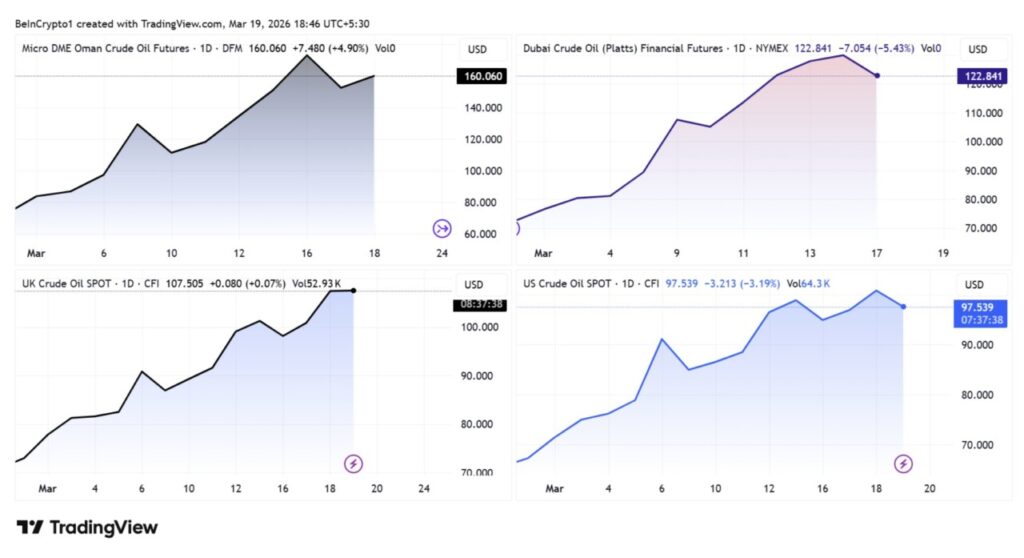
The physical oil market is showing very high pressure. The price of Oman crude jumped to $173 per barrel, while Dubai crude climbed through $150. These levels far exceed more commonly quoted benchmarks such as Brent and WTI. The gap indicates that the global oil market may not yet fully reflect the severity of the ongoing supply shortage.
When energy prices spike, inflation expectations rise with them. This makes the market further delay the projected interest rate cut.
Gold and Silver Confirm Broader Market Pressure
The sell-off was not limited to the crypto market. Traditional safe haven assets also took a hit, further confirming that this event was driven by macroeconomic factors.
Gold prices fell by 5%, while silver fell by more than 10% in just one day. These declines suggest that investors are not shifting funds to safe assets, but rather liquidating positions across various asset classes.
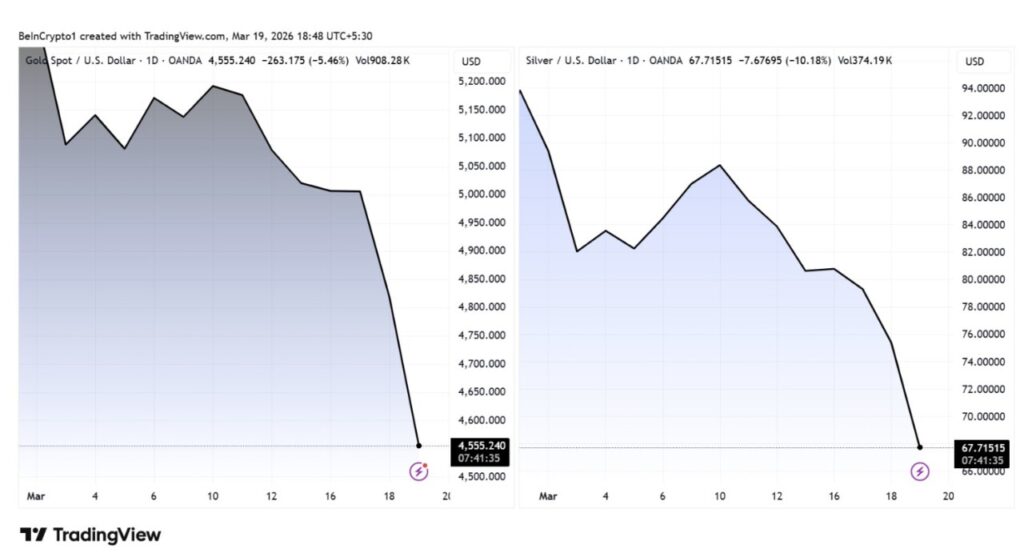
Currently, gold has lost almost $1,000 per ounce from its latest peak, which shows how quickly market sentiment changes.
Oil Market Signals Point to Hidden Global Shocks
One of the most important signals in the current market conditions is the widening gap between Brent and WTI oil prices.
Brent crude, the global benchmark, has surged to the range of $115-$119 per barrel. Meanwhile, WTI is still moving lower around $95-$99. This gap reflects the “war premium” associated with supply chain disruptions in the Middle East, particularly impacting Europe and Asia.
Read also: Latest Pi Network Price Predictions after Smart Contract Launch and Second Migration
Analysts think the full impact has yet to be felt in Western markets. If supply disruptions continue, inventories in the United States and Europe could potentially get tighter, which could eventually push global prices even higher.
Liquidity Conditions Begin to Put Pressure on Risky Assets
The Federal Reserve’s decision to hold interest rates while signaling that no cuts are imminent further strengthens the narrative of longer-term high interest rates. This tightens the financial situation at a time when the market had already priced in the possibility of a rate cut in mid-2026.
According to market observers, this change triggered a rapid repricing of risk assets, with Bitcoin dropping from $72,400 to below $70,000 in just a matter of hours.
Historically, this kind of environment tends to suppress speculative assets, as capital typically moves to instruments that offer stability and more certain returns.
What’s Next for Bitcoin?
Despite the short-term volatility, analysts think that macro-driven corrections like this are nothing new for Bitcoin. In previous interest rate hike cycles, Bitcoin also experienced a sharp decline before recovering when liquidity conditions began to improve.
Crypto strategist Michael van de Poppe thinks that further declines are still possible if the pressure in the energy market continues to worsen. However, the current price level is also considered a potential long-term accumulation area.
According to him, the market is weakening as the escalation in the Middle East heats up again. If this situation does not subside, the market is considered not to have a strong reason to move higher. He estimates that various markets, including Bitcoin, still have the potential to go down to lower areas. But in a long-term perspective, the current price level is considered attractive for Bitcoin accumulation.
Key macro catalysts to watch include Fed Chair Jerome Powell’s speech on March 21 as well as the latest developments regarding tensions in the Middle East.
These two factors will determine whether expectations of interest rate cuts strengthen again, or if the current sell-off continues to deepen.
Conclusion
Bitcoin’s drop below $70,000 is not just a typical crypto market correction. It reflects a combination of tightening liquidity pressures, rising inflation due to the energy boom, and rising global geopolitical tensions.
As long as the market continues to readjust risk perception, Bitcoin will remain highly sensitive to changes in macroeconomic conditions.
Follow us on target="_blank" rel="noreferrer noopener" href="https://news.google.com/u/2/publications/CAAqBwgKMKXoywsw1YPjAw?hl=id&gl=ID&ceid=ID%3Aid">Google News to stay up to date with the latest in crypto and blockchain technology. Check Bitcoin price, usdt to idr and tokenized nvidia stock price through Pintu Market.
Enjoy an easy and secure crypto trading and crypto gold investment experience by downloading the Pintu crypto app via Play Store or App Store now. Also, experience web trading with advanced trading tools such as pro charting, various order types, and portfolio tracker only at Pintu Pro.
*Disclaimer
This content aims to enrich readers’ information. Pintu collects this information from various relevant sources and is not influenced by outside parties. Note that an asset’s past performance does not determine its projected future performance. Crypto trading activities are subject to high risk and volatility, always do your own research and use cold hard cash before investing. All activities of buying and selling Bitcoin and other crypto asset investments are the responsibility of the reader.
Reference:
- BeInCrypto. Bitcoin Slips Below $70,000 In A Selloff Too Big for a Single Explanation. Accessed on March 20, 2026
Berita Terbaru
© 2026 PT Pintu Kemana Saja. All Rights Reserved.
Kegiatan perdagangan aset crypto dilakukan oleh PT Pintu Kemana Saja, suatu perusahaan Pedagang Aset Keuangan Digital yang berizin dan diawasi oleh Otoritas Jasa Keuangan serta merupakan anggota PT Central Finansial X (CFX) dan PT Kliring Komoditi Indonesia (KKI). Kegiatan perdagangan aset crypto adalah kegiatan berisiko tinggi. PT Pintu Kemana Saja tidak memberikan rekomendasi apa pun mengenai investasi dan/atau produk aset crypto. Pengguna wajib mempelajari secara hati-hati setiap hal yang berkaitan dengan perdagangan aset crypto (termasuk risiko terkait) dan penggunaan aplikasi. Semua keputusan perdagangan aset crypto dan/atau kontrak berjangka atas aset crypto merupakan keputusan mandiri pengguna.