Download Pintu App
Ethereum Falls to $2,100: Is a Break Above $2,800 Still Possible?
Jakarta, Pintu News – Ethereum (ETH) briefly moved up after successfully reclaiming a key support area above $2,100, while the short-term chart shows that this rally is starting to approach an important resistance zone. The combination of these two conditions leads to one simple question: will ETH be able to stay above support long enough to continue its rise towards $2,800, or will a correction occur first?
Ethereum Price Drops 2.77% in 24 Hours
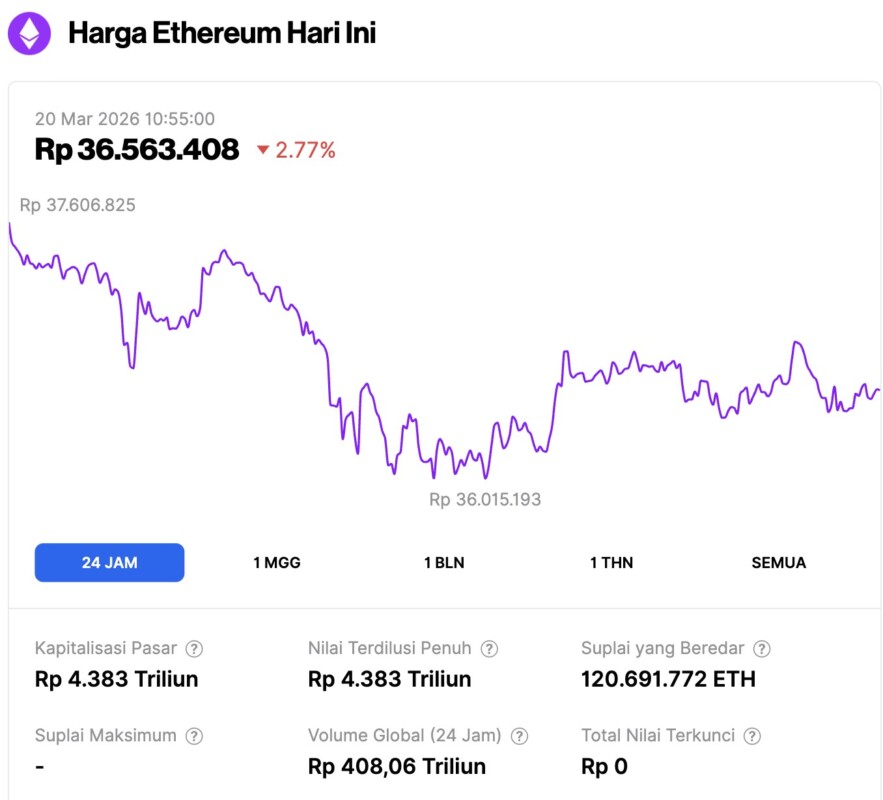
On March 20, 2026, the price of Ethereum was recorded at around $2,151 or the equivalent of IDR 36,563,408, a decrease of 2.77% in the last 24 hours. During this period, ETH had touched its lowest level at IDR 36,015,193 and its highest level at IDR 37,606,825.
As of writing, Ethereum’s market capitalization now stands at around IDR 4,383 trillion, with daily trading volume falling 7% to IDR 408.06 trillion in the last 24 hours.
Read also: Bitcoin Price Weakens to $70,000 Today: What Will Happen Next?
Ethereum regains control of the $2.1K area and opens up opportunities to reach $2.8K
Ethereum is again moving above an important area on the high time frame, which is in the range of $2,100 to $2,166. This zone is now the most crucial level to watch. On the chart, ETH can be seen bouncing off support around $1,808 and then climbing back into the price range that was its moving area throughout most of 2024.
As such, the market’s attention has now shifted from simply recovering the decline to the question of whether prices are able to hold this newly reclaimed area.
The structure of the movement on the chart is quite clear. ETH managed to re-enter the large range of $2.1K to $2.8K after previously trading below this area. Thus, this zone now serves as the nearest major support area.
If Ethereum is able to hold above it, the next upside target could potentially be around $2,851, which was previously one of the important levels in the movement range during 2024. This level is also in line with the upper limit marked on the chart.
At the same time, the chart also indicates that ETH is still moving from one level to another, not yet showing a really strong trend breakout. Daan Crypto Trades also highlighted this. According to his view, as long as the $2.1K area is maintained, there is still a chance of a rise towards $2.8K.
However, this move still needs further confirmation. If the price is quickly rejected again to drop below $2.1K, then the recovery signal will weaken and the market focus could shift back to the lower support zone.
The broader context also remains important. Ethereum is still quite far below the 2021 all-time high area around $4,089, as well as still below another important resistance around $3,349. So, while the recent uptick looks quite positive, ETH is actually still moving within a large multi-year range. In other words, the current condition is more accurately seen as a recovery within the price range, rather than a full bullish breakout.
Read also: Pi Network Price Prediction After PI Mainnet Upgraded to Protocol 20!
For now, the main read is quite simple. Ethereum has managed to reclaim a large support zone, and that’s keeping the upside pressure alive. If the $2.1K area is able to hold, then $2.8K becomes the next important level worth monitoring. Conversely, if that support fails to hold, the market could potentially drop back towards the $1,808 area.
Ethereum Nearing Wave (3) Top, Correction Zone Begins to Form Around $2.2K
As of March 19, 2026, Ethereum was briefly trading at around $2,327 after completing a strong run-up that was in line with a possible wave (3) structure. The chart shows that the price has reached the 1.38 Fibonacci extension level around $2,344, which is often a short-term resistance area. As such, the upward momentum starts to look slow as it approaches the zone.
At the same time, the price movement structure indicates that Ethereum could potentially enter a correction phase. The Fibonacci retracement levels marked on the chart place the main support zone in the range of $2,234 to $2,145. This area is very important. If the price experiences a pullback to that range and is able to hold, it will reinforce the wave (4) correction scenario before continuing the next leg up.
The chart also still shows a broader uptrend, with a higher low pattern forming since the $1,755 and $1,919 area. This structure keeps the short-term trend positive for the time being. Even so, the price is still below the next resistance around $2,468, which also coincides with the higher Fibonacci extension level.
The Man of Bitcoin thinks that a drop below the $2,145 level will weaken the wave structure that is forming. If that happens, the current pattern will no longer support the continuation of the upward movement, and downside risks will increase.
For now, Ethereum is between resistance at the 1.38 extension level and support in the $2.2K area. The next movement will largely be determined by whether the price is able to hold the support zone or break it down.
Follow us on Google News to stay up to date with the latest in crypto and blockchain technology. Check Bitcoin price, usdt to idr and tokenized nvidia stock price through Pintu Market.
As a safe crypto app, Pintu provides a crypto trading experience to access crypto gold investment easily and conveniently. You can also see today’ s gold jewelry price and today’s gold bullion price to support your investment activities and portfolio diversification as well as learn crypto through Pintu Academy.
Download the Pintu crypto app via Play Store or App Store now. Enjoy web trading experience with advanced trading tools such as pro charting, various types of order types, and portfolio tracker only at Pintu Pro.
*Disclaimer
This content aims to enrich readers’ information. Pintu collects this information from various relevant sources and is not influenced by outside parties. Note that an asset’s past performance does not determine its projected future performance. Crypto trading activities are subject to high risk and volatility, always do your own research and use cold hard cash before investing. All activities of buying and selling Bitcoin and other crypto asset investments are the responsibility of the reader.
Reference:
- Coinpaper. ETH Reclaims Support, $2.8K Becomes Key Target. Accessed on March 20, 2026
Berita Terbaru
© 2026 PT Pintu Kemana Saja. All Rights Reserved.
Kegiatan perdagangan aset crypto dilakukan oleh PT Pintu Kemana Saja, suatu perusahaan Pedagang Aset Keuangan Digital yang berizin dan diawasi oleh Otoritas Jasa Keuangan serta merupakan anggota PT Central Finansial X (CFX) dan PT Kliring Komoditi Indonesia (KKI). Kegiatan perdagangan aset crypto adalah kegiatan berisiko tinggi. PT Pintu Kemana Saja tidak memberikan rekomendasi apa pun mengenai investasi dan/atau produk aset crypto. Pengguna wajib mempelajari secara hati-hati setiap hal yang berkaitan dengan perdagangan aset crypto (termasuk risiko terkait) dan penggunaan aplikasi. Semua keputusan perdagangan aset crypto dan/atau kontrak berjangka atas aset crypto merupakan keputusan mandiri pengguna.