Download Pintu App
Ethereum Slides to $2,000 as Red Volume Bars Signal Growing Weakness
Jakarta, Pintu News – The price of Ethereum (ETH) broke through a crucial technical level around $2,110 again, repeating the pattern that triggered a 20% rally earlier this month.
However, two on-chain signals suggest that this breakout attempt is likely to face stronger resistance than before. The main difference between March 9, when the previous recovery took place, and today’s conditions lies in who still wants to sell and how much upside space is available before holders start realizing profits.
Then, how is Ethereum’s current price movement?
Ethereum Price Drops 4.59% in 24 Hours
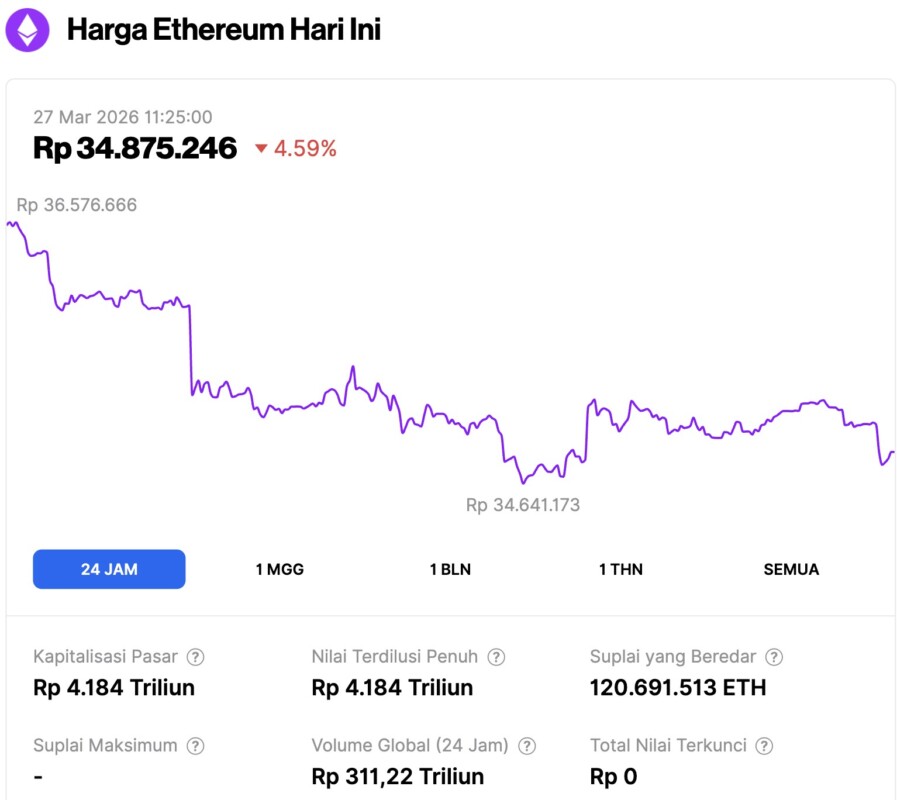
On March 27, 2026, Ethereum traded at around $2,050, or approximately IDR 34,875,246, after declining 4.59% over the past 24 hours. During that period, ETH fell to a low of IDR 34,641,173 and reached a high of IDR 36,576,666.
At the time of writing, Ethereum’s market capitalization stood at roughly IDR 4,184 trillion. Meanwhile, its daily trading volume climbed 12% over the last 24 hours to IDR 311.22 trillion.
Read also: Bitcoin Falls to $68,000: What’s Next for BTC in the Short Term?
The appearance of red volume bars is a cautionary signal after SMA reclaiming
Since February 6, ETH has been moving inside an ascending parallel channel pattern on the daily chart, which formed after the price corrected 43% from the January 28 swing high. However, this channel pattern is not necessarily a bullish signal.
Ascending channels that appear after a sharp decline often reflect a trend continuation pattern rather than a reversal. As such, ETH still needs to break the upper trendline, or at least cross the most important swing high, to confirm a noticeable change in trend.
The 20-day Simple Moving Average (SMA), a trend indicator that calculates the average daily closing price over the past 20 days, was recaptured on March 9 and drove a rally of around 20% until March 16. The bull run was supported by consecutive green volume bars, signaling buyer dominance throughout the bullish phase.
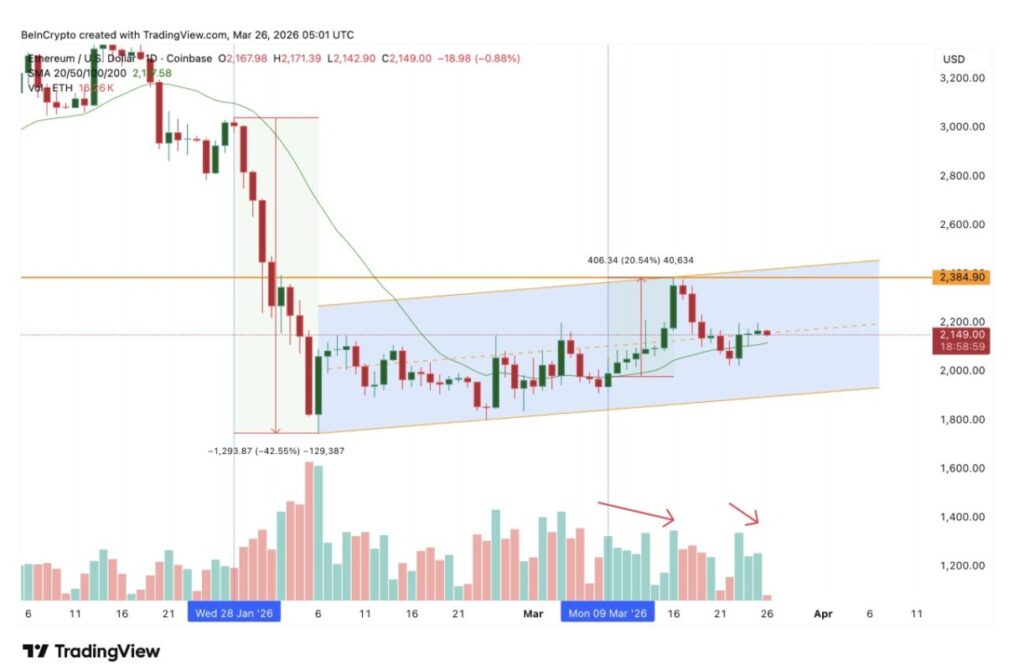
However, things look different this time around. The latest reclaim did start off with fairly solid volume, but red volume bars had already started to appear on the March 26 candle. The presence of red volume bars suggests selling pressure started to enter the market as the rally progressed, something that was not seen in the previous March 9 breakout.
The current daily candle is still forming, so a change in the direction of buying interest late in the session could still change this picture. If green volume comes back and holds, this SMA reclaim could still potentially develop into a larger advance.
However, volume alone is not enough to explain why the ETH upside limit is potentially lower this time. The explanation can be seen in the on-chain profitability data.
NUPL Shows Holder’s Reasons to Hold on are Diminishing
Net unrealized profit/loss (NUPL), an indicator that measures the aggregate profitability of holders across all Ethereum addresses, stood at around -0.11 on March 8, which is well within its capitalization zone. At that level, the majority of holders are still in a loss position, so the impetus to sell is relatively small.
It was this lack of selling pressure that allowed the reclaim of the then 20-day SMA to continue without much resistance until ETH reached $2,380.
Now, the NUPL reading shows a different situation. As of March 25, the NUPL stood at 0.00061, which is only slightly in positive territory. While this may seem small, it marks a considerable change from the -0.11 level before the previous rally took place. Even on March 22, before the latest reclaim began, NUPL was already at -0.05, which means it was already much higher than its capitulation point at the beginning of the month.
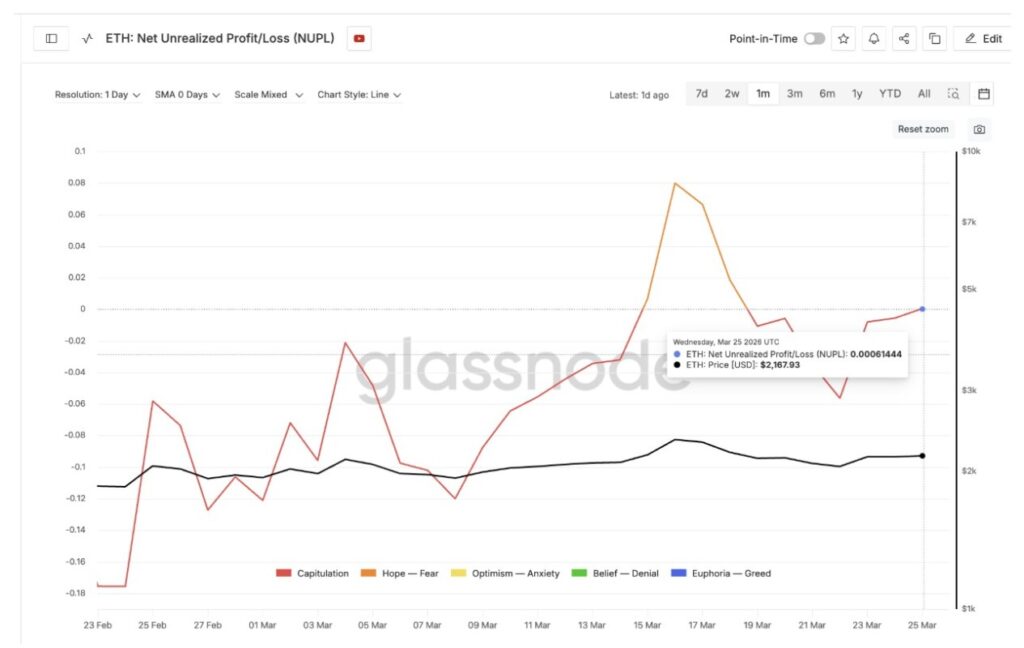
The implications are quite clear. Holders who had incurred huge losses in early March are now starting to get closer to breaking even. Some of them may even be in a good enough position to consider selling, not so much to make a profit, but to reduce losses.
If market participants see ETH momentum starting to weaken, this break-even area could potentially turn into a distribution zone, where supply pressure is greater than demand.
Even so, there is one group that has not shown any selling interest, and that is the Ethereum whales, defined as large non-exchange wallets. According to Santiment data, their collective holdings increased from 121.72 million ETH to 122.62 million ETH in the period from March 24 to 26. The increase of about 900,000 ETH, with an estimated value of about $1.94 billion at current prices, reflects the confidence of large-cap holders.
However, whale accumulation this time has not been as aggressive as the early March period. In fact, such buying aggressiveness was one of the factors that drove Ethereum’s price rally up 20% earlier, even when the NUPL also increased.
Read also: Solana Price Prediction: SOL Weekly Support Still Holding, Trend Direction to Decide
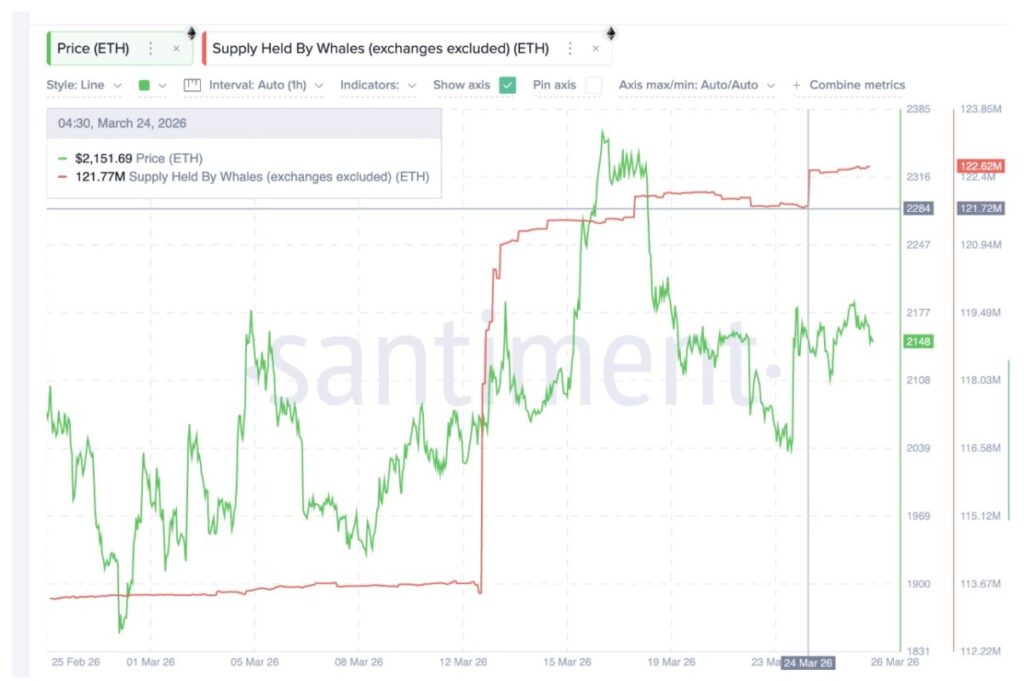
Currently, the NUPL is higher, but whales have not been seen adding large amounts of ETH holdings. This begs the question: are they still waiting for confirmation of the next price direction?
Ethereum Price Levels Now Depend on Realized Price Barriers
The outlook for Ethereum’s price movement in the current phase is largely determined by ETH’s ability to close above the $2,330 to $2,410 confluence area, which are two important technical levels.
According to Glassnode data, ETH’s realized price, which is the average accumulated price of all coins on the network, is above $2,350, right in the middle of the confluence zone. In volatile market conditions, the realized price area often serves as crucial support or resistance.
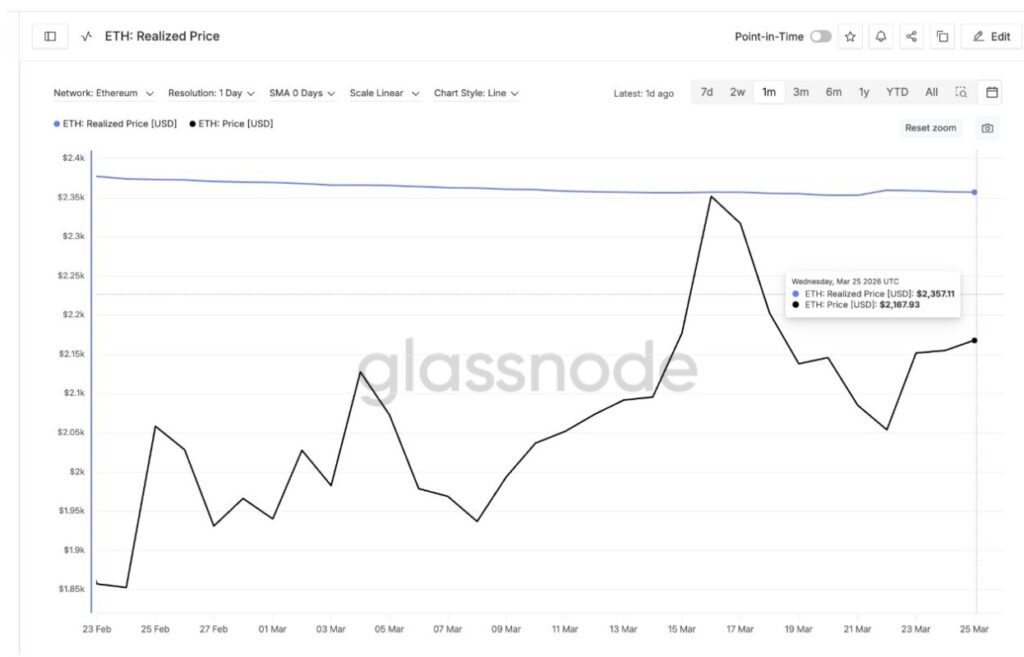
This zone is important because if ETH is able to record a daily close above $2,410, three positive signals will be formed at once. First, the ETH price will move above the realized price, indicating that the average holder is starting to get into a more convincing position.
Second, the 0.618 Fibonacci resistance level will be broken, confirming the breakout from the ascending channel. Third, the price will also surpass the swing high of $2,380 that previously capped the ETH rally in March.
If that scenario occurs, Ethereum’s next resistance levels are at $2,520, $2,650, and the 1,618 extension level at $3,050. This means that, theoretically, the opportunity for ETH to head back towards the $3,000 area still remains open.
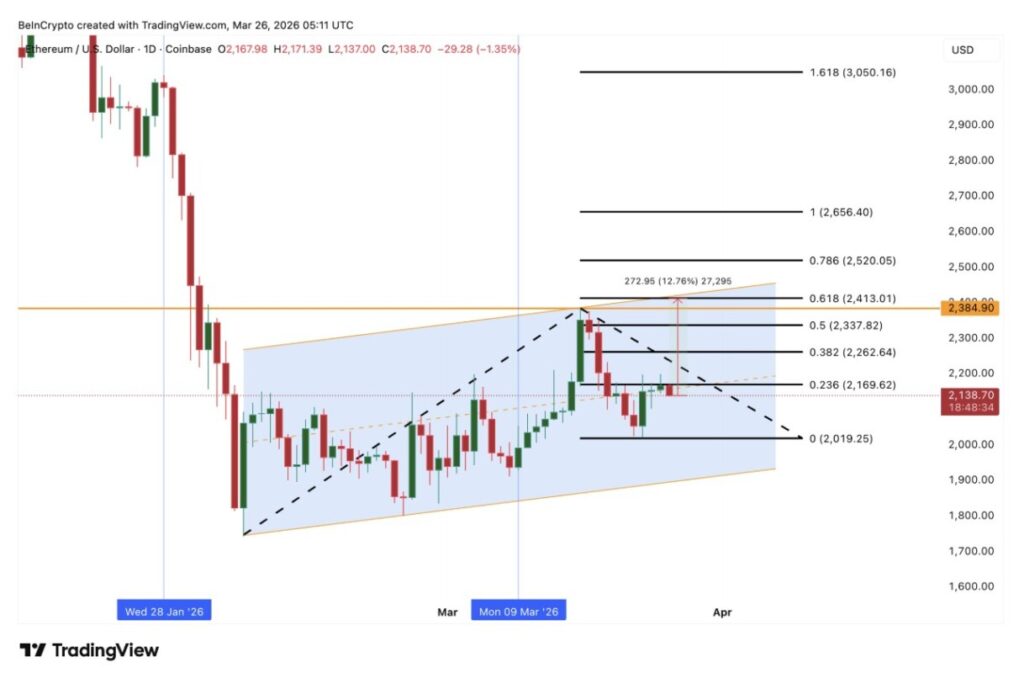
On the downside, the first level to defend is at $2,160. A daily close below this area would indicate that buyers who were previously propping up the reclaimed SMA are starting to remove their support. After that, there is support at $2,010, and if this level is broken, the risk of a drop below $2,000 will reopen.
As such, a daily close above $2,410 becomes the deciding limit between a whale accumulation-backed rally towards $3,000 or a price slide back to the bottom of the channel.
Follow us on Google News to stay up to date with the latest in crypto and blockchain technology. Check Bitcoin price, usdt to idr and tokenized nvidia stock price through Pintu Market.
As a safe crypto app, Pintu provides a crypto trading experience to access crypto gold investment easily and conveniently. You can also see today’ s gold jewelry price and today’s gold bullion price to support your investment activities and portfolio diversification as well as learn crypto through Pintu Academy.
Download the Pintu crypto app via Play Store or App Store now. Enjoy web trading experience with advanced trading tools such as pro charting, various types of order types, and portfolio tracker only at Pintu Pro.
*Disclaimer
This content aims to enrich readers’ information. Pintu collects this information from various relevant sources and is not influenced by outside parties. Note that an asset’s past performance does not determine its projected future performance. Crypto trading activities are subject to high risk and volatility, always do your own research and use cold hard cash before investing. All activities of buying and selling Bitcoin and other crypto asset investments are the responsibility of the reader.
Reference:
- BeInCrypto. Ethereum (ETH) Price Faces a Critical Ceiling Ahead of the $3,000 Dream. Accessed on March 27, 2026
Berita Terbaru
© 2026 PT Pintu Kemana Saja. All Rights Reserved.
Kegiatan perdagangan aset crypto dilakukan oleh PT Pintu Kemana Saja, suatu perusahaan Pedagang Aset Keuangan Digital yang berizin dan diawasi oleh Otoritas Jasa Keuangan serta merupakan anggota PT Central Finansial X (CFX) dan PT Kliring Komoditi Indonesia (KKI). Kegiatan perdagangan aset crypto adalah kegiatan berisiko tinggi. PT Pintu Kemana Saja tidak memberikan rekomendasi apa pun mengenai investasi dan/atau produk aset crypto. Pengguna wajib mempelajari secara hati-hati setiap hal yang berkaitan dengan perdagangan aset crypto (termasuk risiko terkait) dan penggunaan aplikasi. Semua keputusan perdagangan aset crypto dan/atau kontrak berjangka atas aset crypto merupakan keputusan mandiri pengguna.