Range Trading with Limit Order

Are you looking to profit from a sideways market? No problem! Consider implementing a range trading strategy that utilizes limit orders. All it takes is the identification of clear support and resistance levels and the precise setting of entry and exit points with limit orders. Wondering how to go about this? Curious about which indicators can be used? Read on in this article.
Article Summary
- ↔️ Range trading is a trading method that focuses on asset price movements between support and resistance levels. The key is to buy at a low price and sell at a high price within that range.
- ✨ In range trading, the use of Limit Order feature can make the process easier, as they automatically execute buy and sell orders at the target price.
- 📊 Traders can use indicators such as support and resistance, pivot points, on-balance volume, and RSI to determine the target price.
- 🚨 In addition to Limit Orders, it is important to always use cut-losses as risk management in range trading.
What is Range Trading?
In market movements, assets often trade within a defined range. They tend to rebound as they approach the support area, and they struggle to break through the resistance level, causing a retreat. This pattern continues until a significant change in momentum occurs (a breakout).
Some traders capitalize on these movements by implementing a range trading strategy. Range trading is a method that leverages the price fluctuations of an asset moving consistently within a specific price range. Therefore, determining the trend line between support and resistance points is crucial in range trading.
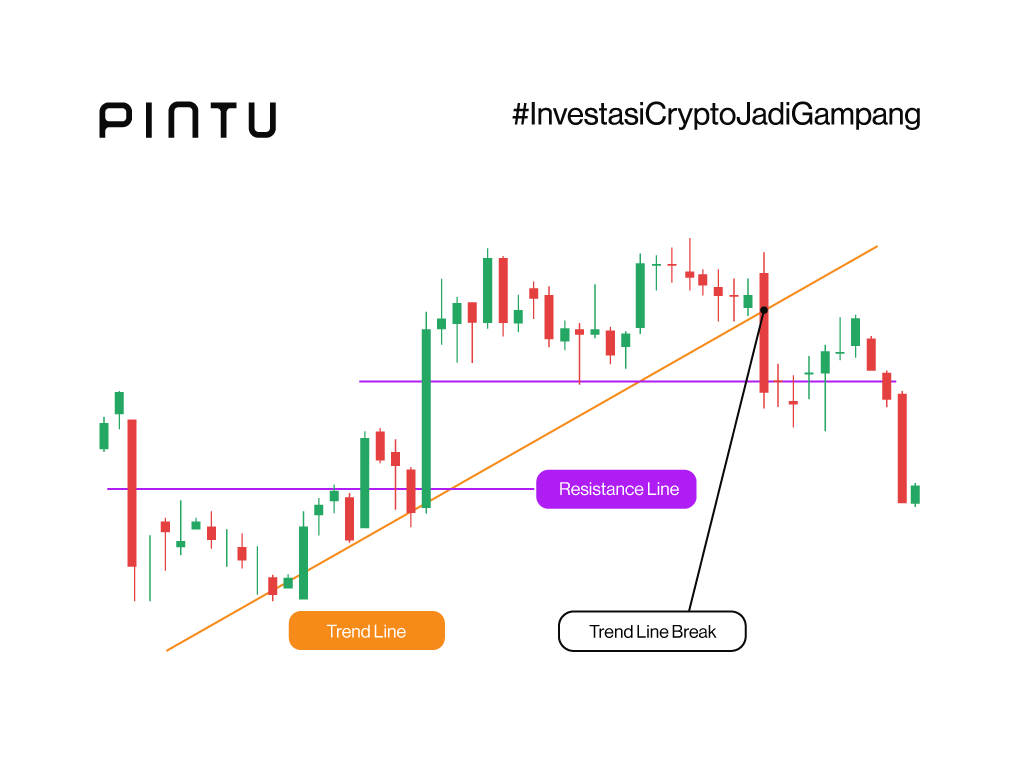
The idea of this trading method is to buy at the support area and then sell at the resistance area. As the movement repeats, traders can also repeat the buying and selling action. As a result, although the returns obtained may be small, the accumulative results can be significant because they are obtained repeatedly.
The reliability of trendlines as support and resistance areas are determined by how often the price of an asset reacts to them. The more often the price crosses the trendline, the more reliable it will be.
Learn more about support, resistance, and how to create a trendline in the following article.
Using Limit Order for Range Trading
So, what role does the Limit Order feature play in range trading? In short, its use will make range trading easier and more optimized. As mentioned earlier, in range trading, assets must be purchased at the support area and sold when at the resistance area.
Using market orders can be exhausting, as traders must closely monitor market conditions and price movements. Moreover, there’s the risk of executing orders outside the desired target price. With limit orders, everything becomes automated and straightforward. Traders only need to set the target price for their buy and sell limit orders.
Choosing the right crypto asset is essential to ensure that a range trading strategy using limit orders can run smoothly. Two main criteria must be met. First, the asset must have high liquidity enabling traders to enter and exit the market swiftly. Second, the asset must have high volatility. The more volatile the price, the more opportunities there are to buy at support and sell at resistance.
Example of Range Trading Using Limit Order
For instance, let’s take the case of Budi, who observed Bitcoin trading in the range of US$26,000 to US$28,000 over the past three months. According to his calculation, the US$ 26,125 level is a vital support area and US$ 28,000 as a key resistance area for BTC. And then, he set a buy limit order at US$26,175 and a sell limit order at US$27,950.
When the price of Bitcoin touches US$ 26,175, the buy limit order is automatically executed. At the same time, Budi continues to observe market dynamics to ensure that BTC’s price aligns with his expectations. When it turns out that BTC tests its resistance level and passes the US$ 27,950 level, the sell limit order will also be executed automatically. Through this approach, Budi managed to pocket a profit of 6.78%.
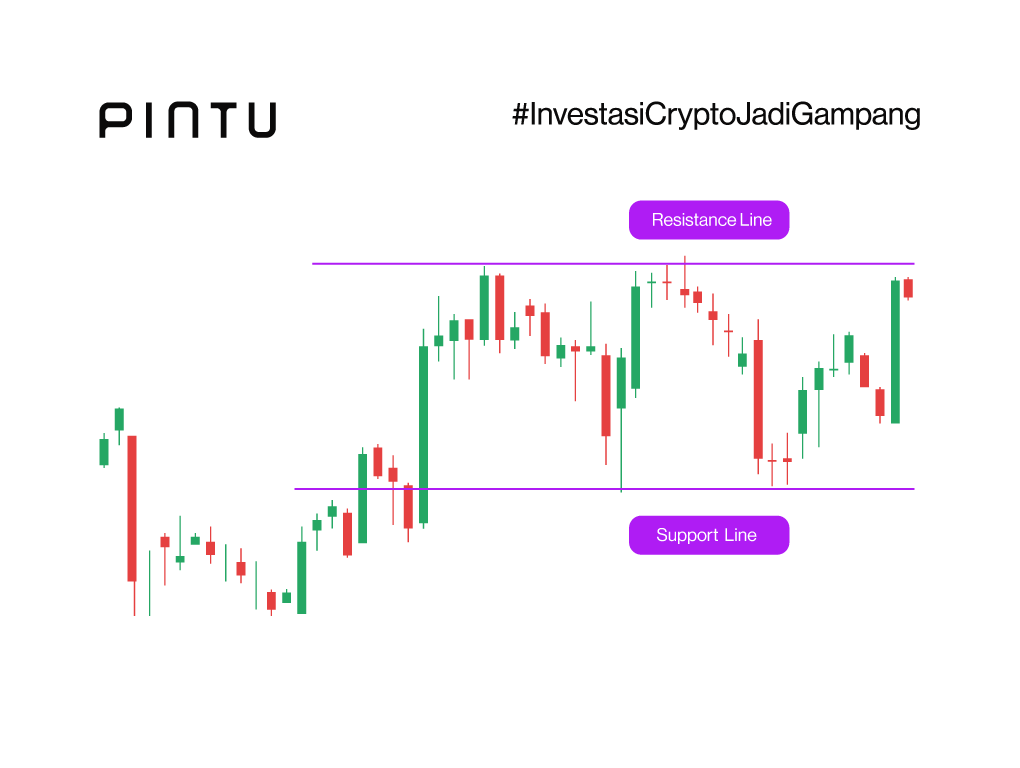
If the movement over several months still has the same pattern, Budi’s range trading strategy will likely work for the third, fourth, or even fifth time. Accumulatively, he could pocket a 6.78% profit for five times.
Disclaimer: All numbers above are examples and intended for illustrative purposes only. You should develop your trading plan based on your risk tolerance and goals. Remember always to do your own research.
Interested in trying to use a Limit Order? Here’s a guide on how to use a Limit Order.
Technical Indicators Used in Range Trading
Drawing trend lines is probably the easiest way to determine support and resistance. However, some of the following technical indicators can also be used:
1. Pivot Points
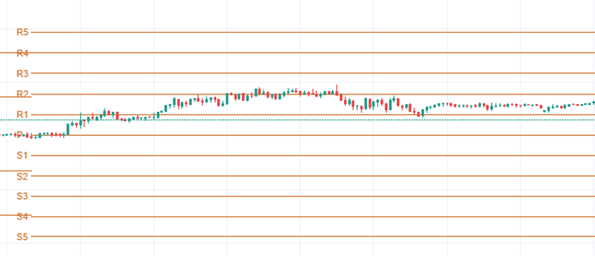
Pivot points are indicators that calculate the average intraday highs, lows, and closing prices of the previous sessions. It can be used as a point in determining support and resistance. The reason is that the line indicates a point that an asset cannot cross.
Similar to trend lines, the more often an asset price is near pivot points, the stronger they will be as support and resistance areas. Each line on the pivot points can be used as a reference point for support and resistance.
2. Relative Strength Index
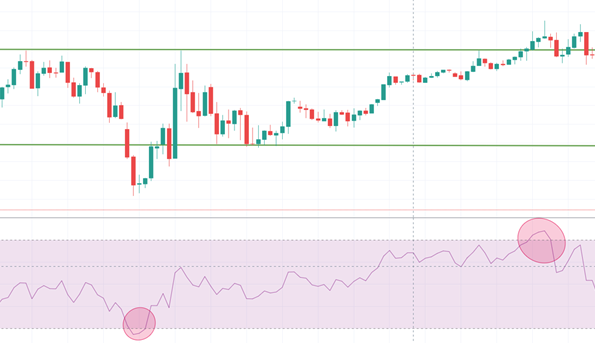
The Relative Strength Index (RSI) indicator is often used in conjunction with pivot points or trendlines to confirm overbought and oversold signals. RSI is measured on a scale from 0 to 100. When the RSI falls below 20 and continues to rise (indicating oversold conditions), it signals the discovery of a support level, suggesting a potential price rebound. When the RSI is above 80 and then moves down (indicating an overbought condition), it may signify that the resistance point has been reached and the price will go down.
As illustrated in the image above, when the asset price intersects the trendline, the RSI indicator also highlights overbought and oversold conditions. Keep in mind that a stand-alone RSI indicator may not give significant signals. However, when combined with other indicators, it can provide confirming signals.
3. On-Balance Volume
Volume is one of the most important indicators in range trading. It provides information on whether or not a price movement (trend) has strength behind it. This means that volume can be used as an indicator to confirm signals.
In theory, the volume indicator should precede the price. So, if a new trend is forming, the volume movement should also increase. In range trading, traders will look for volume indicators that move down before the price reaches a support or resistance point. Then, the volume rises again when the price reverses.
If the indicator shows the volume is still rising at the support or resistance line, the price will cross that point. However, the breakout will likely be false if the price crosses the support or resistance point with low volume. The price will still move in the same range.
These four crypto trading indicators are considered the best. What are they? Find out here.
Steps to Create a Range Trading Strategy Using Limit Orders
To create a range trading strategy using limit orders, here are a few things to do:
- Identify the price range. Begin by analyzing an asset’s price chart and identifying recent high and low points. The price range encompasses the area between these two points. To enhance accuracy, consider using multiple technical indicators.
- Use Limit Orders to enter and exit the market. Once the price range is determined, pinpoint the support and resistance levels. Then, set a buy limit order slightly above the support level and a sell limit order just below the resistance level. This approach ensures that you enter and exit the market at optimal prices.
- Pay attention to market dynamics. Although limit orders can automate the process, we still need to monitor market conditions in range trading. If there is a market change, traders can adjust their trading strategy.
- Remember to set a cut-loss. Given that market conditions can reverse at any time, you must also be prepared to cut-loss in range trading. Simply put, the target price for cut-loss is below the support point. However, to be precise, it can be adjusted to your risk of loss tolerance.
Pros and Cons of Range Trading
The following are some of the pros of range trading:
- 🔆 Well-defined range. Range trading offers clear entry and exit points as support and resistance levels are easily identifiable. This simplifies the management of stop-losses.
- 💯 More predictable prices. As assets move within a specific price range, the stability of price movements allows traders to use technical analysis and indicators more efficiently.
- 🤑 Potential for recurring gains. Repeated ups and downs in price movements can present regular profit opportunities.
The following are some of the cons of range trading:
- ⌛ Limited profit. For traders with a more aggressive trading approach, range trading offers a more limited profit.
- 🚫 Inflexibility. When market conditions are volatile due to uncertainty or carried by positive trends, range trading strategies are difficult to implement.
- ⚠️ False breakouts. It is not uncommon for an asset to experience false breakouts. This can trigger the execution of cut-loss when the price will return to the initial area.
Check out the following article from Pintu Academy to learn how to interpret doji candles.
Conclusion
Range trading using Limit Orders is a strategy that capitalizes on asset price fluctuations within a specific price range. This involves buying an asset at the support level and selling it when it reaches the resistance level. By utilizing Limit Orders, traders can automate entering and exiting trades.
In the context of range trading, selecting assets with high liquidity and volatility is key to maximizing profit potential. Technical indicators such as Pivot Points, RSI, and On-Balance Volume can also help determine the target price for limit orders. These indicators can provide entry and exit signals and confirm the strength of the price trend.
However, always considering the risks and using proper risk management is also essential. You can use cut-loss to protect trading capital from possible unexpected price movements.
Buy Crypto Assets on Pintu
Looking to invest in crypto assets? No worries, you can safely and conveniently purchase a wide range of cryptocurrencies such as BTC, ETH, SOL, and others safely and easily on Pintu. Pintu diligently evaluates all its crypto assets, highlighting the significance of being cautious.
Pintu is also compatible with popular wallets such as Metamask to facilitate your transactions. Download Pintu app on Play Store and App Store! Your security is guaranteed because Pintu is regulated and supervised by Bappebti and Kominfo.
Aside from buying and trading crypto assets, you can expand your knowledge about cryptocurrencies through various Pintu Academy articles. Updated weekly, all Pintu Academy articles are made for knowledge and educational purposes, not as financial advice
References
- James Chen, What Is Range-Bound Trading? Definition and How Strategy Works, Investopedia, accessed on 12 October 2023.
- Rebecca Cattlin, Range trading: definition, strategies and indicators, Forex, accessed on 12 October 2023.
- Peter Ajayi, A Guide to Range Trading, Medium, accessed on 12 October 2023.
- Baby Pips, What Are Pivot Points? accessed on 12 October 2023.
Share

