Market Analysis 3-9 July: BTC Relief Rally, July Interest Rates, and AAVE Stablecoin

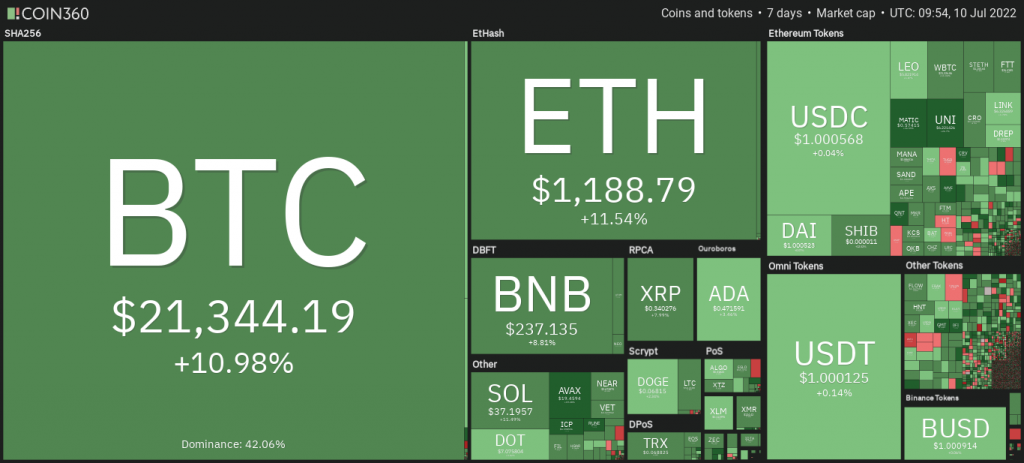
The past week brought a bit of good news for the crypto market. Bitcoin managed to rise from $19,000 US dollars and reached around $21,000 US dollars. With BTC moving up, altcoin also moves similarly. The team of traders at Pintu has collected various data about the movements of the cryptocurrency market over the past week. In addition, the Pintu Academy team also brings various important news from the crypto world. Please note that the information from the market analysis is intended to provide education and information, not financial advice.
Market Analysis Summary
- ️ ⚖️ Over the past week, BTC has rallied and risen above the 21-week resistance line. However, this rise seems to be a relief rally in a bear market that may be short-lived and possibly turn into a bull trap.
- 📉 Bitcoin is still below the 200-week MA which indicates that the bear market is not over yet. This is the 3rd weekly candle BTC price is below the resistance line.
- 🏦 US Consumer Price Index (CPI) data will be out on July 13. Then, the FOMC meeting to determine the Fed’s interest rate will take place July 26-27. These two announcements will have a significant impact on crypto and stock markets.
- 🤞 The Net Unrealized Profit/Loss (NUPL) indicator shows that Investors are in a capitulation phase and the incentive to sell is decreasing. Reserves on crypto exchanges have also continued to fall, indicating that selling pressure is starting to subside.
BTC Price Movement 3-9 July 2022
Over the past week, the crypto market has seen a slight rally, with BTC rising above the 21-week resistance line. However, this price rally seems to be a relief rally and we haven’t found the real bottom for now. This is why we will see several relief rallies in a bear market condition. Short traders protect their profits by winding/covering their short positions and the bull traders join in to create a relief rally.
So, a possible scenario is that the current price rise will be short-lived and bull traders will fall into a bull trap.
💡 A relief rally is a phenomenon of a brief price increase in adverse market conditions. It usually occurs because there is an oversell of assets that creates a temporary price increase. Short covering is a strategy short traders use to maintain their profits by buying assets to increase prices and then closing their short positions. Meanwhile, bull trap is a situation in which a price briefly rises in a downtrend and then drops back more sharply, trapping new buyers.
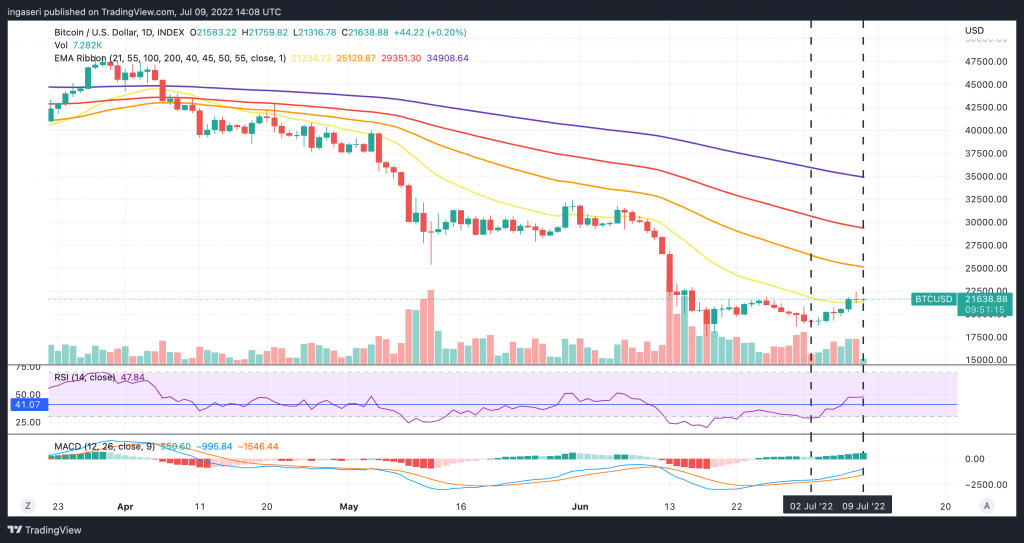
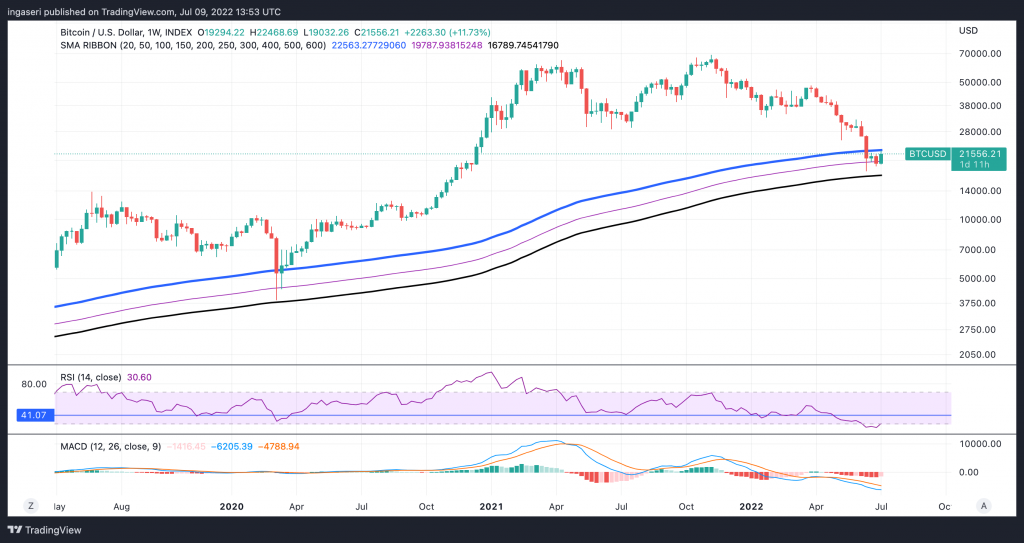
Notice that we are still below the 200-week MA. This is the 3rd weekly candle where the BTC price is below the resistance line. So, the market is still bearish and we need to reclaim the 200-week moving average and make it support.
Read more: Several technical indicators for trading crypto.
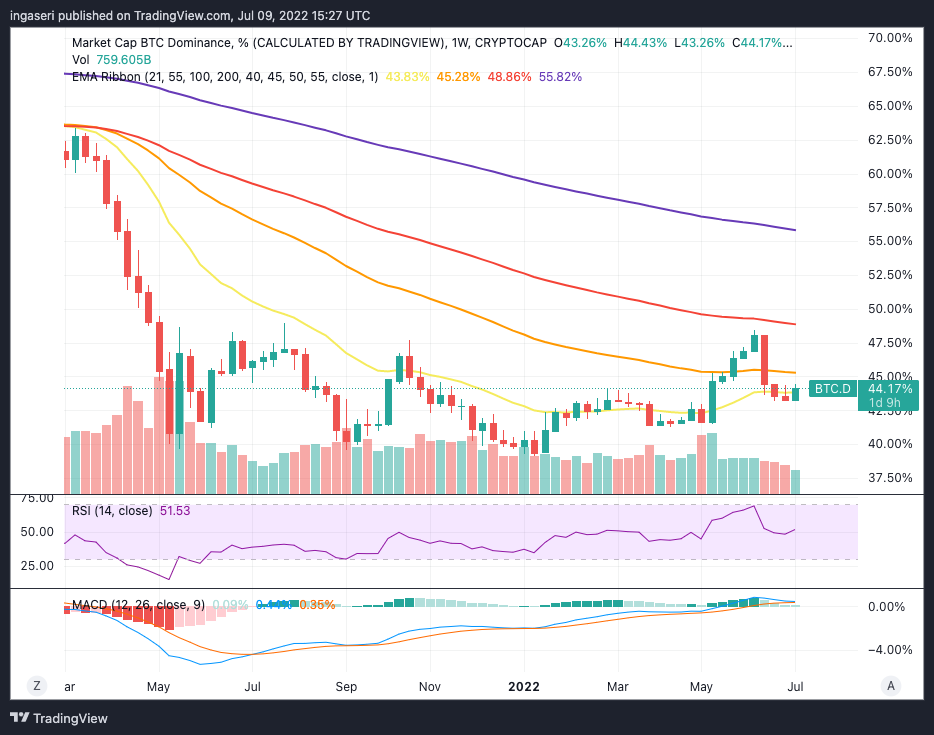
BTC dominance is up 2.1% this week after 3 weeks of straight losses. BTC is once again above the 21-week EMA.
July will be an important month for crypto. Consumer Price Index (CPI) data will be out on July 13. This will be followed by the announcement of the Fed funds rate by the FOMC on July 26-27. Then, on July 28, the forecast for the US Gross Domestic Product (GDP) will determine whether the US is in a technical recession.
The FOMC is expected to raise the Fed Funds rate by 50 or 75 basis points.
Fed rate hike expectations at the next 4 FOMC meetings:
- July: 75 bps increase to 2.25%-2.50%
- Sep: 50 bps increase to 2.75%-3.00%
- Nov: 50 bps increase to 3.25%-3.50%
- Dec: 25 bps increase to 3.50%-3.75%
After recording a -1.6% GDP decline in Q1 2022, a second straight quarter GDP decline would put the US into recession (technically). If this is true, Bitcoin will face a recession for the first time.
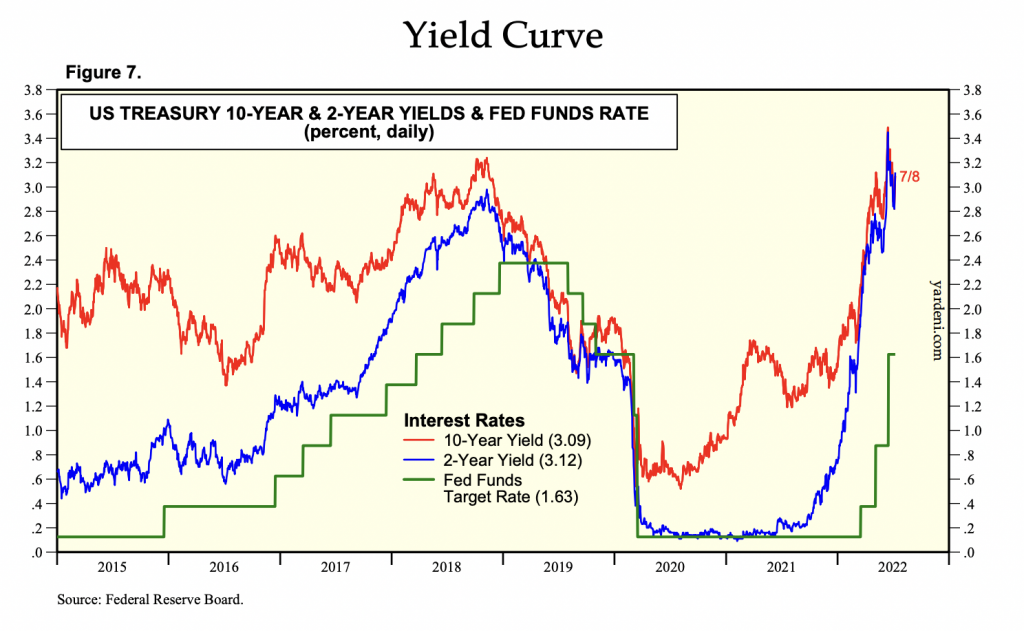
The 10-year and 2-year US treasury yield curves have reversed, meaning that the 2-year yield is now higher than the 10-year.
This inversion is a warning sign that the economy may be falling or has fallen into a recession. However, we also need to pay attention to the amount of time spent in this yield inversion. Generally, a recession will only occur a few quarters after the inversion.
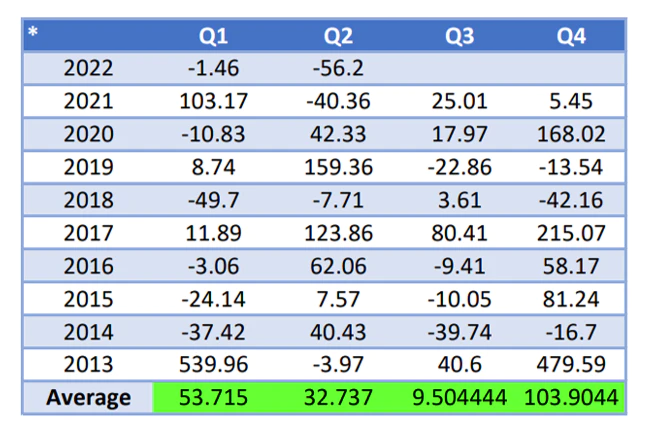
Q2 2022 has been the worst quarter in BTC history in terms of price movements. Prices have fallen -56% on a quarter-on-quarter basis. Also, notice how the 3rd quarter is usually the worst-performing quarter.
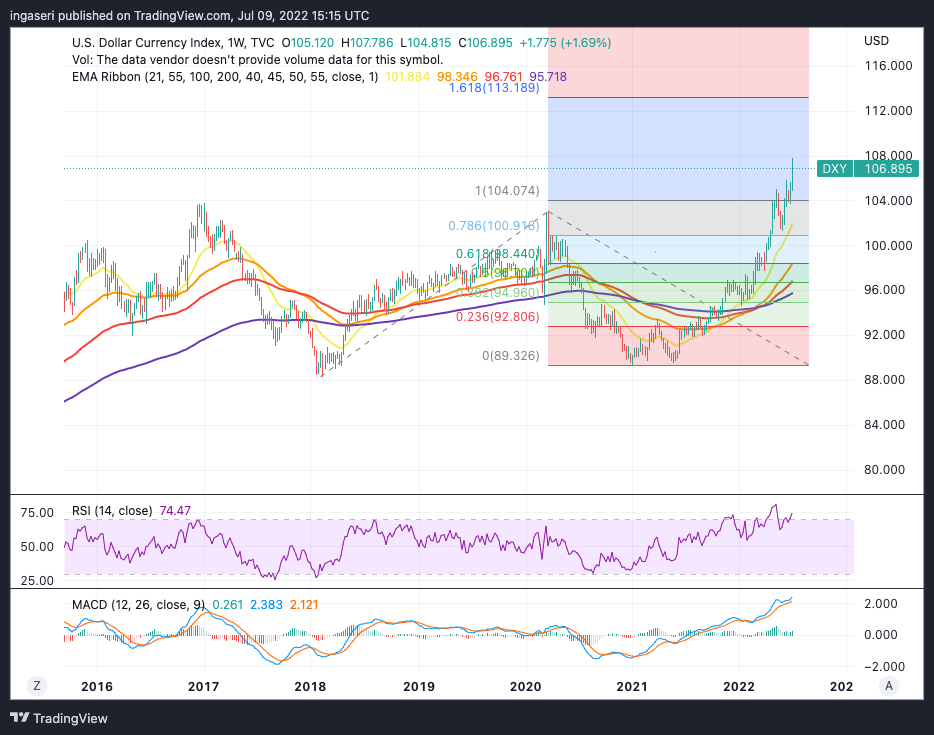
The US dollar (USD) has strengthened to its highest level since December 2002. Usually, The market experiences a correction or a bear market when the USD is strong.
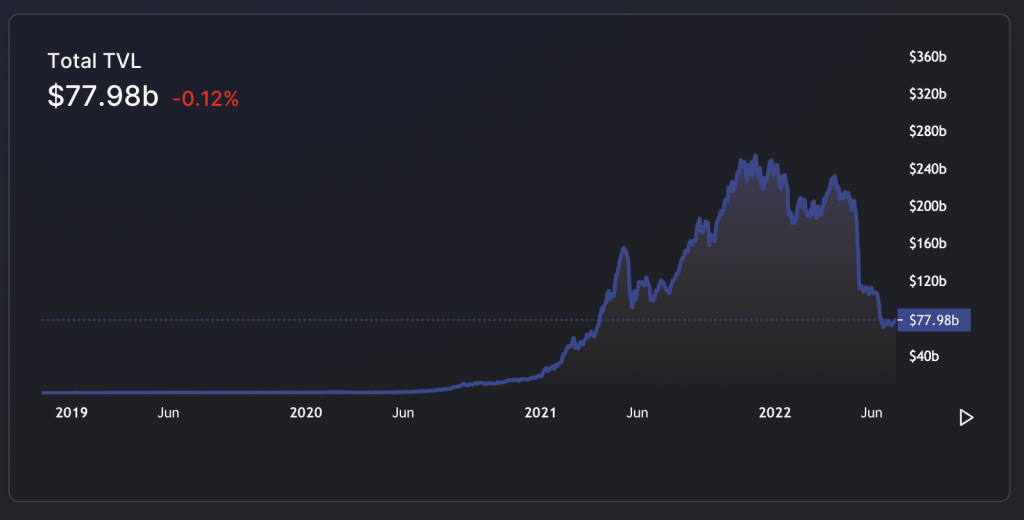
DeFi’s TVL (total value locked) figure has reached $77 billion dollars, down nearly 70% from its peak in December 2021 ($250 billion US dollars). However, Based on the Price-to-Sales (P/S) ratio, some DEXs and lending protocols with respectable revenue and strong fundamentals may have entered undervalued price territory.
On-Chain Analysis
After several weeks of massive cash flows from miners, whales, and holders to exchanges that have managed to keep the bitcoin price down, the flow seems to have stopped over the last seven days.
Exchange reserves continued to fall, indicating that selling pressure was starting to subside. Net deposits on the exchange are moderately low when compared to the 7-day average. Lower deposits can be interpreted as lower selling pressure. In addition, miners sell holdings in a moderate range compared to their one-year average.
ASOPR at 0.98. More investors are selling at a loss. In the middle of a bear market, this could indicate the bottom part of the market.
Binary CDD at 0. (This is a metric that increases when long-term token holders trade or move their coins for selling purposes. It calculates whether long-term holder moves in the last 7 days were higher or lower than the average (0: low, 1: high). If the value is more than 0.5, it indicates that the movement of long-term holders is higher than the average). The movement of long-term holders in the last 7 days was lower than average. They have a motive for holding their coins.
Net Unrealized Profit/Loss (NUPL) at -0.0245. Investors are in a capitulation phase where they are currently facing unrealized losses. So, this indicates a decrease in the motive for realizing losses which leads to a decrease in selling pressure.
Funding level: short traders dominate the position and are willing to pay the long trader.
Taker Buy Sell Ratio: Buying sentiment is dominant in the derivatives market. More buy orders are filled by takers.
Open interest increased by 17% in 1 week. The increase in OI indicates more attention, liquidity, and volatility is coming into the derivatives market. So, the upward trend in OI can support the ongoing price trend.
News From the Altcoins World
- 🤝 Reddit X Polygon: Reddit, one of the most popular social media in the world, has just teamed up with Polygon to create an NFT marketplace. Users can buy NFT in this digital marketplace using regular fiat money and users can directly store it in Reddit’s digital wallet, Vault.
- 🪙 AAVE Stablecoin: AAVE, one of the largest lending platforms on Ethereum, announced the creation of its own algorithmic stablecoin, GHO. Users can deposit GHO by providing collateral in their selected crypto assets equivalent to the value borrowed. All policies related to GHO are governed by the AAVE community except the interest rates which are determined by AAVE. The current sentiment among the AAVE community is still positive regarding GHO.
Other Important News From The Crypto World
- 🌋 Bitcoin Mt. Gox: Bitcoins from users of the Mt. Gox (charged with fraud in 2014) crypto exchange are finally starting to be returned. The total Bitcoin refunded was 150,000 BTC equivalent to $3 billion US dollars at today’s price. Bitcoin will experience huge sell pressure if Mt. Gox users decided to sell their Bitcoin.
- ☠️ Celsius case continuation: Arkham Intelligence, a blockchain analysis firm, released a report on Celsius (a crypto lending platform managing $3,3 billion US dollars in assets). The report explains that Celsius uses its users’ assets in a high-risk trading strategy through various DeFi platforms. This report emphasizes the dubious practices in which the assets of users are exposed to various unnecessary risks.
Cryptocurrency Performance Over The Past Week
References
- Ivan Mehta, Reddit is launching a new NFT avatar marketplace, Tech Crunch, accessed on 11 July 2022.
- Shaurya Malwa, Aave Proposes Decentralized, Yield-Generating Stablecoin GHO, Coin Desk, accessed on 11 July 2022.
- William Suberg, Bitcoin faces Mt. Gox ‘black swan’ as trustee prepares to unlock 150K BTC, Coin Telegraph, accessed on 11 July 2022.
- Andrew Asmakov, Celsius Lost $350M of Client Funds From ‘High-Risk’ Levered Trading: Arkham Report, Decrypt, accessed on 11 July 2022.
Share