Download Pintu App
Bitcoin Hovers at $109,000 — Chart Looks Bullish, So What’s Holding Back the Breakout?
Jakarta, Pintu News – Bitcoin (BTC) started the month of November quietly, stabilizing around $110,350 after a flat price movement over 24 hours (2/11). Bitcoin’s price chart still suggests a potential reversal, as the pattern formed remains intact – this structure usually signals a possible significant price spike.
However, despite these signals, BTC has not managed to break through the key level. The on-chain data reveals the reasons why the price movement is still on hold, as well as factors that could possibly trigger changes going forward.
Then, how will the Bitcoin price move today?
Bitcoin Price Drops 0.45% in 24 Hours
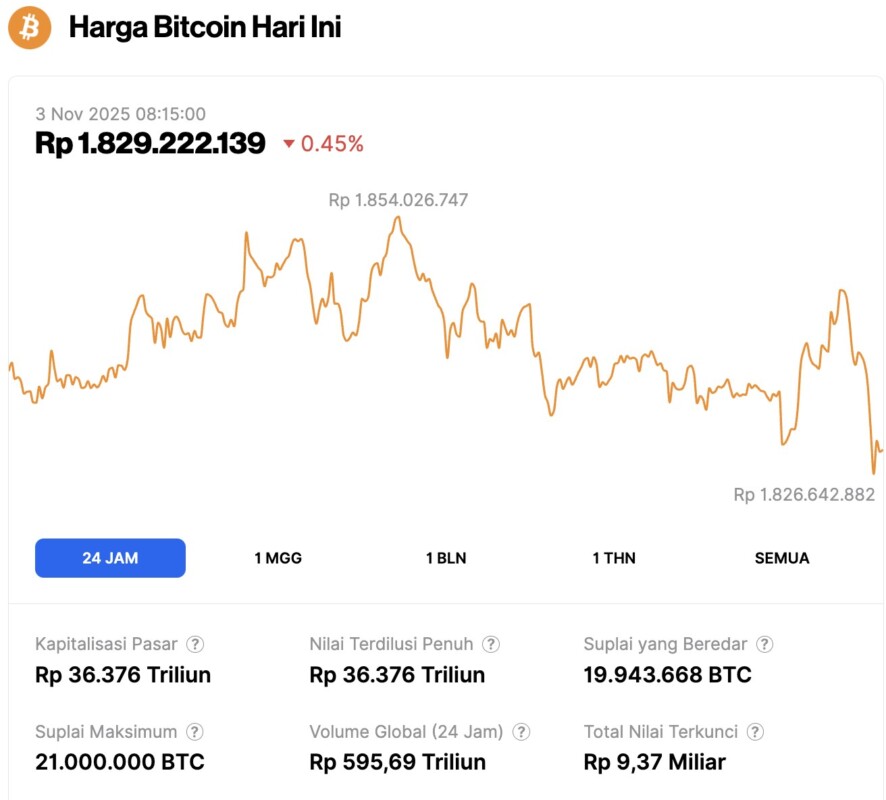
On November 3, 2025, Bitcoin was trading at $109,758, equivalent to IDR 1,829,222,139, marking a slight 0.45% correction over the past 24 hours. During this period, BTC hit a low of IDR 1,826,642,882 and a high of IDR 1,854,026,747.
At the time of writing, Bitcoin’s market capitalization is approximately IDR 36,376 trillion, with 24-hour trading volume jumping 38% to IDR 595.69 trillion.
Read also: Will Altcoin Season Happen in November 2025? Here’s What Crypto Analysts Say
Cost Basis Heatmap Shows Reasons Why Bitcoin Price Is Still on Hold
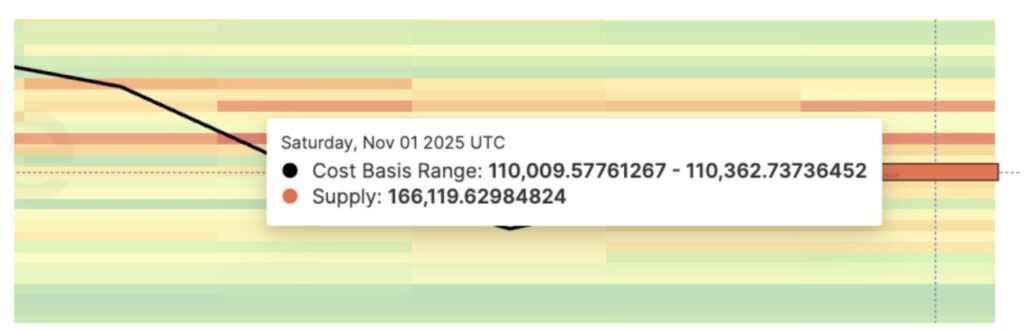
Bitcoin’s cost basis distribution heatmap – a graph that shows at what price level investors last bought their coins – reveals why BTC continues to struggle to break through current price levels.
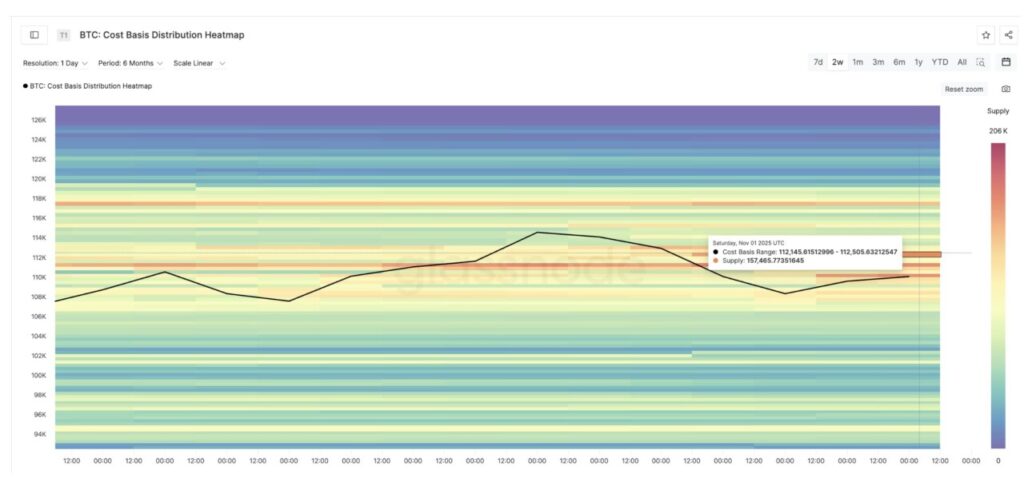
Between the $110,000 to $112,500 range, there is a large supply zone where approximately 434,000 BTC was last accumulated. Dense areas like this are often resistance levels, as many traders who buy in this range tend to want to sell when the price hits their purchase price again.
This heatmap is useful for identifying concentrations of Bitcoin holder activity, and shows which price levels are support or resistance.
It is this wall of supply between $110,000 and $112,500 that has limited BTC’s rally attempts over the past week. In the price chart – which will be discussed later – these levels also coincide with important technical indicators, further reinforcing the significance of the price range.
As long as Bitcoin has not been able to close the daily price convincingly above $112,500, the reversal pattern is still considered valid, but on hold, waiting for a clear trigger.
Whale Action could be a Trigger for Change
The whales – the owners of large wallets – may be preparing to be the next trigger of price movement. On-chain data shows that large wallets holding between 1,000 and 10,000 BTC are starting to accumulate again.
The change in the number of whale addresses in the past 30 days is now back to positive (+6) for the first time since August 31, signaling that the accumulation phase is starting to be active again after several months of relative passivity.
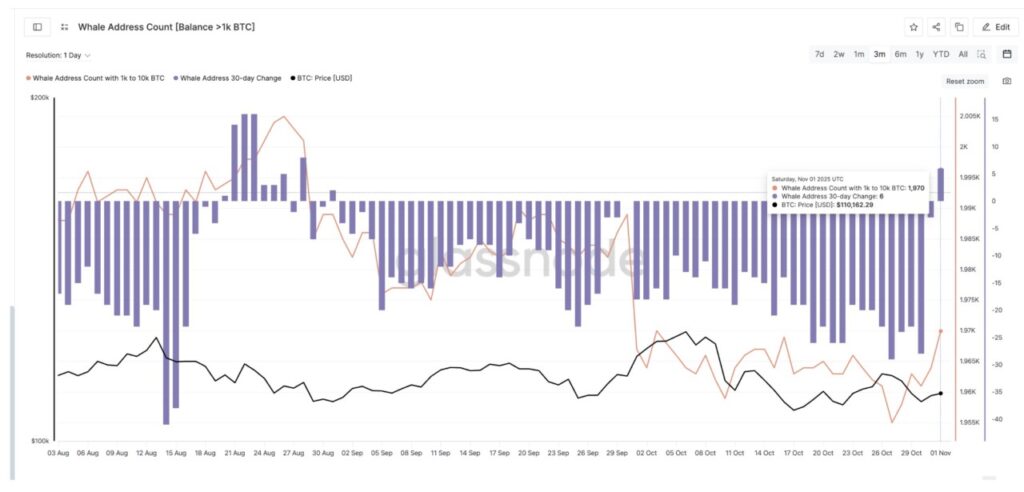
Meanwhile, the total number of whale addresses fell to a three-month low on October 27, but has since started to rise again, and has now returned to levels last seen on October 3.
This increase reflects the return of confidence from large players – a trend that often precedes price breakouts. The dashboard that monitors these wallets also includes addresses belonging to exchanges, ETFs, and custodians, giving a comprehensive picture of institutional activity.
Read also: 4 Cryptos in the Spotlight as Record Rates of Bitcoin Adoption by Enterprises Rise!
If this uptrend continues, then the potential to withstand selling pressure around $112,500 increases – paving the way for a stronger breakout.
BTC Price Chart: Bullish Pattern, But Still Waiting for a Trigger?
Technically, Bitcoin is still moving within a clear inverse head and shoulders formation – a pattern that usually signals a potential upward reversal. If BTC is able to close the daily price above $116,400, the breakout will be confirmed, with further targets in the range of $122,000, $125,900, and $130,800.
Supporting this bullish scenario, the Relative Strength Index (RSI) indicator – a tool for measuring buying and selling strength – shows a bullish divergence.
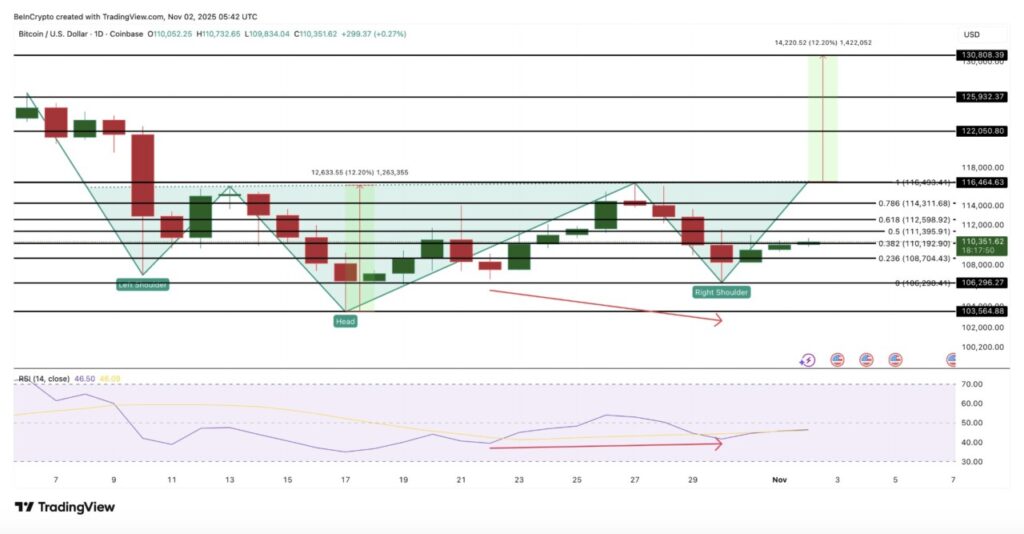
Between October 22 and 30, the Bitcoin price recorded lower lows, while the RSI recorded higher lows (an indication that buying power was starting to increase). This pattern often signals the beginning of a trend reversal and the start of upward momentum.
It is worth noting that on the BTC price chart, the $112,590 million level became a key resistance point. This level reinforces the theory that the breakout was held back due to the supply zone, as described in the cost basis heat map. For now, the $112,500 to $112,590 area is the most crucial zone in the short term.
However, if Bitcoin drops below $106,200, the breakout structure that is still forming could start to lose its strength. And if the decline continues to break $103,500, then this bullish pattern is considered a complete failure – signaling that the power of sellers has completely taken over the market.
That’s the latest information about crypto. Follow us on Google News to get the latest crypto news about crypto projects and blockchain technology. Also, learn crypto from scratch with complete discussion through Pintu Academy and stay up-to-date with the latest crypto market such as bitcoin price today, xrp coin price today, dogecoin and other crypto asset prices through Pintu Market.
Enjoy an easy and secure crypto trading experience by downloading Pintu crypto app via Google Play Store or App Store now. Also, get a web trading experience with various advanced trading tools such as pro charting, various types of order types, and portfolio tracker only at Pintu Pro.
*Disclaimer
This content aims to enrich readers’ information. Pintu collects this information from various relevant sources and is not influenced by outside parties. Note that an asset’s past performance does not determine its projected future performance. Crypto trading activities have high risk and volatility, always do your own research and use cold cash before investing. All activities of buying and selling bitcoin and other crypto asset investments are the responsibility of the reader.
Reference:
- BeInCrypto. Bitcoin Price Chart Still Screams Bullish – So Why Is the Breakout Stalling? Accessed on November 3, 2025
Berita Terbaru
© 2026 PT Pintu Kemana Saja. All Rights Reserved.
Kegiatan perdagangan aset crypto dilakukan oleh PT Pintu Kemana Saja, suatu perusahaan Pedagang Aset Keuangan Digital yang berizin dan diawasi oleh Otoritas Jasa Keuangan serta merupakan anggota PT Central Finansial X (CFX) dan PT Kliring Komoditi Indonesia (KKI). Kegiatan perdagangan aset crypto adalah kegiatan berisiko tinggi. PT Pintu Kemana Saja tidak memberikan rekomendasi apa pun mengenai investasi dan/atau produk aset crypto. Pengguna wajib mempelajari secara hati-hati setiap hal yang berkaitan dengan perdagangan aset crypto (termasuk risiko terkait) dan penggunaan aplikasi. Semua keputusan perdagangan aset crypto dan/atau kontrak berjangka atas aset crypto merupakan keputusan mandiri pengguna.