Download Pintu App
Bitcoin holds strong despite negative correlation trend (11/19/25)
Jakarta, Pintu News – In the often unpredictable world of financial markets, asset correlations can determine one’s financial fortunes, creating synergistic gains or painful declines. Once again, Bitcoin (BTC) proved its resilience while going through a period of negative market correlation.
Bitcoin Market Structure Remains Robust Amid Macro Pressures
Bitcoin (BTC) is currently facing one of the most challenging market correlations yet managed to survive. According to CryptosRus at X, Bitcoin (BTC) and the Nasdaq are moving together, yet Bitcoin (BTC) is reacting more to downturns than upturns. Wintermute in his latest market report points out that this is a pattern usually seen near macro bottoms, not at the top of a cycle.
What’s amazing is that Bitcoin (BTC) has reached several new record highs this year. Despite this, Bitcoin (BTC) is still trading about 25% below its peak, while exhibiting correlation dynamics that illustrate the strength of its uptrend.
Also Read: Gold Outperforming Bitcoin? Asset Performance Analysis in 2025
Fear and Greed Index Shows Market Sentiment
According to CryptoMichNL, founder and CIO of MNFund and MNCapital, the Fear and Greed Index is currently at a level of 14 out of 100, giving an idea of current market conditions comparable to previous occurrences. This level last occurred in February 2025, just before Bitcoin (BTC) experienced a 20% drop in a month, and in June 2022, which marked the lowest point during the Luna crash.
CryptoMichNL concludes that it feels brutal when the broader crypto market and Bitcoin (BTC) fall together, but this phase won’t last forever. That’s why patience is the most profitable strategy.
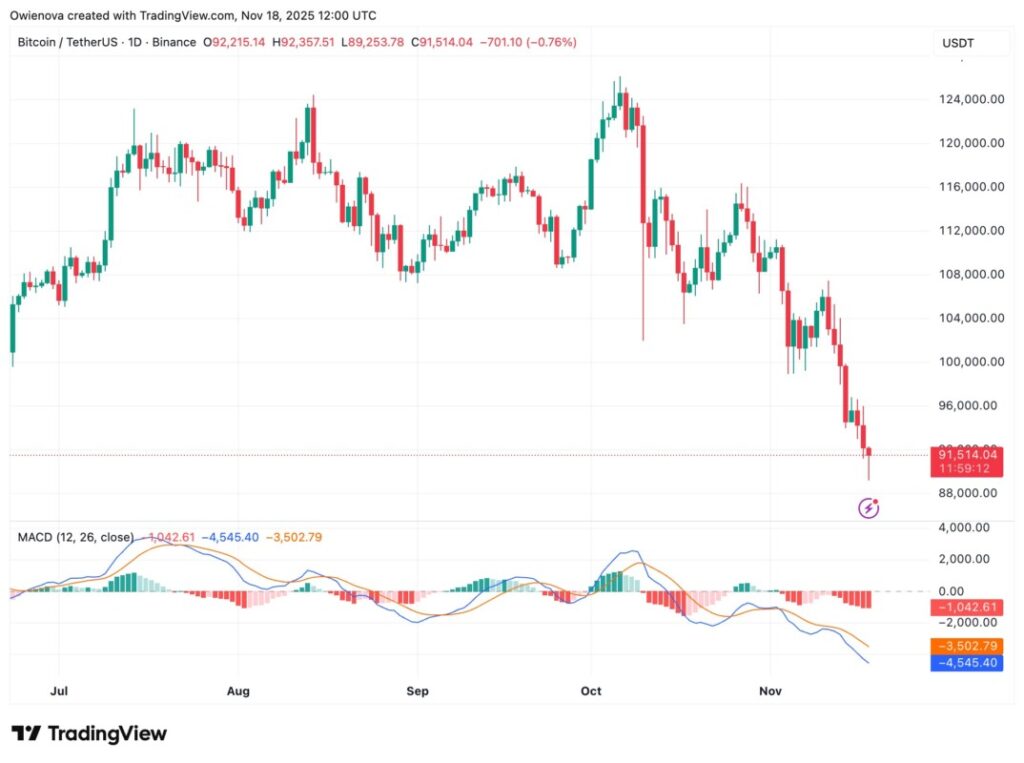
Bitcoin Heads for Key Support Zones
Bitcoin (BTC) is now moving directly towards two major pockets of liquidity, and these zones are likely to act as short-term support as the market searches for direction. Analysts known as Stockmoney Lizards have revealed that the Bitcoin (BTC) liquidation heat map shows a large cluster of long liquidations between $80,000 and $90,000. Meanwhile, there is an apparent CME gap between $92,000 and $92,500 with no tail.
Meanwhile, Bitcoin (BTC) has broken below the weekly supertrend and weekly EMA50, confirming that momentum has not reversed and Bitcoin (BTC) is still in a correction phase. Stockmoney Lizards notes that from here, the $90,000 zone is a natural bounce zone, and we will see if this bounce can trigger a breakout to the upside, or if Bitcoin (BTC) can continue sliding to the mid-$80,000s range.
Conclusion
Despite facing major challenges, Bitcoin (BTC) has shown remarkable resilience in the face of market pressure and negative correlations. By understanding market dynamics and key support zones, investors can be better prepared for possible price fluctuations.
Also Read: 5 Reasons Solana (SOL) Was Scooped Up by Institutions Despite Falling 30%: Whale’s Stealth Strategy?
Follow us on Google News to get the latest information about crypto and blockchain technology. Check Bitcoin price today, Solana price today, Pepe coin and other crypto asset prices through Pintu Market.
Enjoy an easy and secure crypto trading experience by downloading Pintu crypto app via Google Play Store or App Store now. Also, get a web trading experience with various advanced trading tools such as pro charting, various types of order types, and portfolio tracker only at Pintu Pro.
*Disclaimer
This content aims to enrich readers’ information. Pintu collects this information from various relevant sources and is not influenced by outside parties. Note that an asset’s past performance does not determine its projected future performance. Crypto trading activities are subject to high risk and volatility, always do your own research and use cold hard cash before investing. All activities of buying andselling Bitcoin and other crypto asset investments are the responsibility of the reader.
FAQ
Q1: What is the Fear and Greed Index?
A1: The Fear and Greed Index is a tool that measures market sentiment based on two main emotions, fear and greed, which influence how much people are willing to buy or sell crypto assets.
Q2: Why is Bitcoin (BTC) still considered to be in a correction phase?
A2: Bitcoin (BTC) is considered to be still in a correction phase as it has broken below major trend indicators such as the weekly supertrend and weekly EMA50, indicating that the current price momentum is still negative.
Q3: What does the CME gap mean in the context of Bitcoin (BTC)?
A3: The CME gap refers to a price range where no trading has taken place, often seen in the Bitcoin (BTC) futures price chart on the Chicago Mercantile Exchange (CME), which could indicate a potential area of support or resistance.
Q4: How does negative correlation affect the price of Bitcoin (BTC)?
A4: Negative correlation, as seen between Bitcoin (BTC) and the Nasdaq, means that when one market goes down, the other tends to move in the same direction, which could exacerbate the decline in Bitcoin (BTC) price when the stock market goes down.
Q5: What strategies does CryptoMichNL suggest to deal with the current crypto market?
A5: CryptoMichNL suggests that patience is the most beneficial strategy in the face of crypto market fluctuations, pointing out that sharp price drop phases are often short-lived and followed by recoveries.
Reference
- NewsBTC. Bitcoin Shows Negative Correlation With Traditional Markets. Accessed on November 19, 2025
Berita Terbaru
© 2026 PT Pintu Kemana Saja. All Rights Reserved.
Kegiatan perdagangan aset crypto dilakukan oleh PT Pintu Kemana Saja, suatu perusahaan Pedagang Aset Keuangan Digital yang berizin dan diawasi oleh Otoritas Jasa Keuangan serta merupakan anggota PT Central Finansial X (CFX) dan PT Kliring Komoditi Indonesia (KKI). Kegiatan perdagangan aset crypto adalah kegiatan berisiko tinggi. PT Pintu Kemana Saja tidak memberikan rekomendasi apa pun mengenai investasi dan/atau produk aset crypto. Pengguna wajib mempelajari secara hati-hati setiap hal yang berkaitan dengan perdagangan aset crypto (termasuk risiko terkait) dan penggunaan aplikasi. Semua keputusan perdagangan aset crypto dan/atau kontrak berjangka atas aset crypto merupakan keputusan mandiri pengguna.