Download Pintu App
Antam Gold Price Chart Today, January 15, 2026: Strong Trend amid Global Volatility
Jakarta, Pintu News – The price of Antam gold returned to the attention of market participants in today’s trading, Thursday, January 15, 2026, as the price movement showed a strengthening trend in recent days.
Antam’s gold price chart data indicates a gradual increase that is influenced by the dynamics of world gold prices and the condition of the rupiah exchange rate. This situation reflects how gold is still seen as a hedge asset amid global economic uncertainty.
Antam Gold Price Movement in Daily Chart
Based on the latest Antam gold price chart, gold prices show an upward trend compared to the early January period. This movement appears consistent with the world spot gold trend that has strengthened in recent days. The price increase indicates a market response to global factors that affect gold demand.
On the daily chart, price fluctuations remain visible, but within a relatively manageable range. This pattern reflects the balance between buying and selling in the domestic gold market. Investors tend to monitor this movement as a reference to determine the strategy of buying or selling Antam gold.
Also Read: Monero (XMR) sets new record, will it continue to surge in January 2026?
The Effect of World Gold Prices on Antam Gold
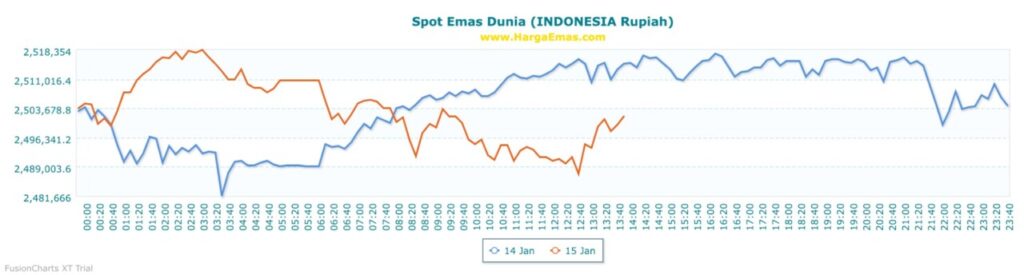
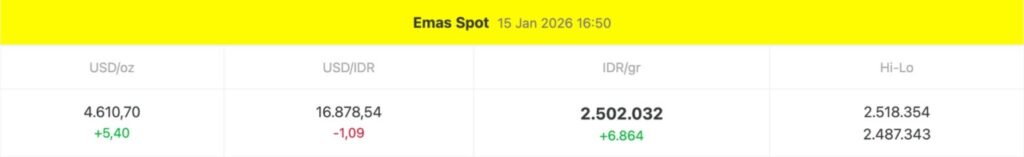
The price of Antam gold is strongly influenced by the movement of world gold prices as reflected in the global gold spot chart. When world gold prices strengthen, Antam gold prices generally follow the same direction with adjustments to the rupiah exchange rate. This can be seen from the chart that shows the correlation between global and domestic trends.
In addition, changes in the rupiah exchange rate against the US dollar also play an important role. A strengthening US dollar can hold back the rise in Antam gold prices, while a weakening rupiah tends to push domestic gold prices higher. The combination of these two factors makes the Antam gold price chart move dynamically.
Short-term Trends and Price Movement Patterns
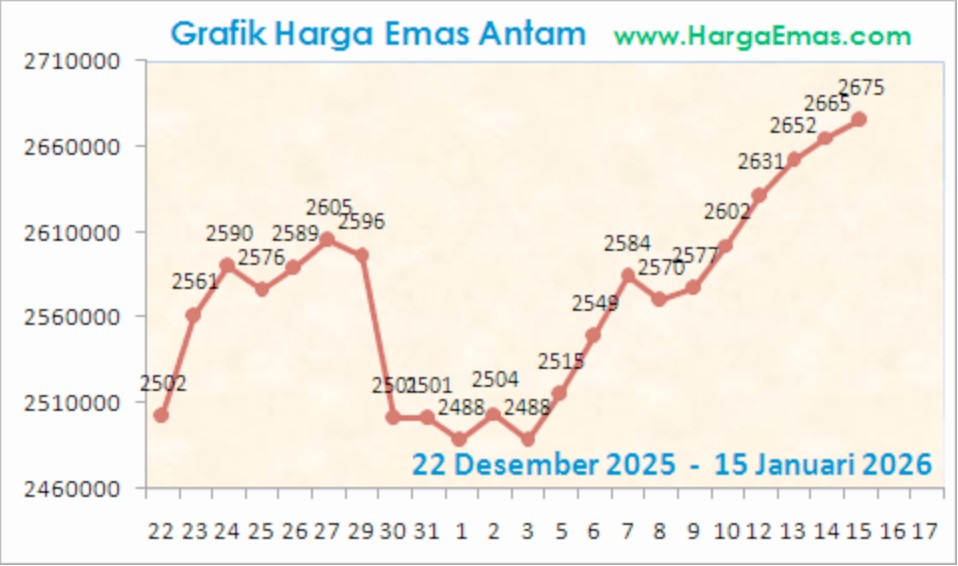
In the short term, the Antam gold price chart shows a gradual upward pattern with some minor corrections. This correction is normal as part of a market mechanism that balances supply and demand. Nevertheless, the direction of price movement still tends to be positive.
Such patterns are often utilized by medium-term gold investors to observe momentum. Price charts become an important tool for reading trends and identifying price levels that are considered attractive. By understanding these patterns, investors can make more measured decisions.
Global Factors Driving Gold Prices
A number of global factors have influenced Antam’s gold price chart today. Uncertainty over global monetary policy and concerns over economic stability are driving interest in gold as a safe asset. This condition is reflected in the strengthening of world gold prices which then has an impact on the domestic market.
In addition, market sentiment towards inflation and interest rates also plays a big role. When inflation expectations increase or real interest rates decrease, gold tends to be an alternative choice for investors. Today’s Antam gold price chart indirectly reflects this sentiment.
Comparison with Previous Period
When compared to the Antam gold price chart at the end of December 2025, today’s price is at a higher level. This increase indicates a strengthening trend over a period of several weeks. This historical comparison is important to understand the context of current price movements.
However, investors still need to pay close attention to the volatility that may occur. The price chart shows that despite the upward trend, price movements do not always go in a straight line. Understanding historical patterns helps investors manage expectations and risk.
The Role of Price Charts for Gold Investors
The Antam gold price chart serves as a visual tool to understand market dynamics. Through the chart, investors can observe trends, patterns and potential price turning points. This information forms the basis for a more planned gold investment strategy.
By utilizing price charts, investors can assess whether the market is in an accumulation or distribution phase. This is important to determine the right time to buy or sell Antam gold. Today’s price chart provides an up-to-date overview of the domestic gold market conditions.
Conclusion of Antam Gold Price Movement Today
Overall, the Antam gold price chart today, January 15, 2026, shows a strengthening trend influenced by world gold prices and exchange rate factors. Despite intraday fluctuations, the direction of price movements is still relatively positive. This condition reflects the market’s continued strong interest in gold as a hedging asset.
For investors, understanding the Antam gold price chart is an important step in reading market conditions. By observing trends and supporting factors, investment decisions can be made more rationally and data-based. Today’s Antam gold price provides an overview of how the market responds to evolving global dynamics.
Also Read: 7 Crypto Oversupply Signals Could Reset Bitcoin to $10,000 – Here Are the Indicators!
Follow us on Google News to get the latest information about crypto and blockchain technology. Check Bitcoin price today, Solana price today, Pepe coin and other crypto asset prices through Pintu Market.
Enjoy an easy and secure crypto trading experience by downloading Pintu crypto app via Google Play Store or App Store now. Also, get a web trading experience with various advanced trading tools such as pro charting, various types of order types, and portfolio tracker only at Pintu Pro.
*Disclaimer
This content aims to enrich readers’ information. Pintu collects this information from various relevant sources and is not influenced by outside parties. Note that an asset’s past performance does not determine its projected future performance. Crypto trading activities are subject to high risk and volatility, always do your own research and use cold hard cash before investing. All activities of buying andselling Bitcoin and other crypto asset investments are the responsibility of the reader.
Reference
- HargaEmas.com. Antam Gold Price Chart Today. Accessed January 15, 2026.
Berita Terbaru
© 2026 PT Pintu Kemana Saja. All Rights Reserved.
Kegiatan perdagangan aset crypto dilakukan oleh PT Pintu Kemana Saja, suatu perusahaan Pedagang Aset Keuangan Digital yang berizin dan diawasi oleh Otoritas Jasa Keuangan serta merupakan anggota PT Central Finansial X (CFX) dan PT Kliring Komoditi Indonesia (KKI). Kegiatan perdagangan aset crypto adalah kegiatan berisiko tinggi. PT Pintu Kemana Saja tidak memberikan rekomendasi apa pun mengenai investasi dan/atau produk aset crypto. Pengguna wajib mempelajari secara hati-hati setiap hal yang berkaitan dengan perdagangan aset crypto (termasuk risiko terkait) dan penggunaan aplikasi. Semua keputusan perdagangan aset crypto dan/atau kontrak berjangka atas aset crypto merupakan keputusan mandiri pengguna.