Download Pintu App
5 Crypto Futures Trading Indicators You Must Know!
Jakarta, Pintu News – Leverage magnifies both opportunities and risks in crypto futures trading. Professional crypto traders don’t speculate recklessly. They use a set of proven indicators and clear rules to time their entries, exits, and manage risk.
In this guide, multiple trading indicatos will learn exactly how professionals use the nine core indicators, how to combine them for strong confluence, as well as how to avoid common pitfalls that often lead to account liquidation.
1. Bollinger Bands: Recognizing Squeezes and Breakouts
Bollinger Bands is a technical indicator that consists of three lines: one center line which is the moving average and two bands above and below it. When the market is calm, these bands narrow. Conversely, when the price starts moving significantly, the bands widen.
Read also: Bitcoin Richest People List: Who will own the most BTC by 2026?
How to use by professionals:
- Squeeze as a movement signal: Traders wait for the bands to narrow (squeeze). If the price manages to break out of the band accompanied by increased volume, this often signals the start of a trend.
- Mean reversion: In a sideways market (moving in a range), when the price touches the outer bands, it often reverts back to the center line.
Tip: In a strong trend, prices may “stick” to the outer bands and continue moving in the same direction. Avoid bucking the trend too soon. In anticipation of a breakout, stop losses should be set outside the opposite band or below a clear swing point.
2. Fibonacci Retracement: Buying When Price Corrects in a Trend
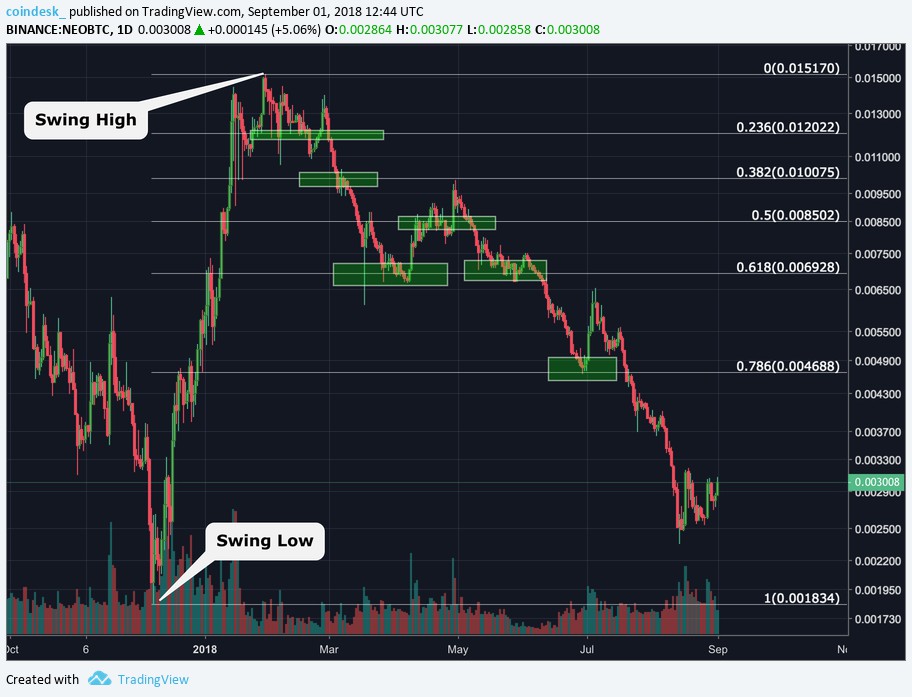
Fibonacci retracement is a technical indicator that helps traders identify potential support and resistance zones during a trend. When the price undergoes a correction, levels such as 38.2%, 50%, 61.8%, up to 78.6% are often the point of attention for traders to look for buying opportunities in an uptrend, or selling opportunities in a downtrend.
How to use by professionals:
- In an uptrend, many traders look for buying opportunities between the 50% to 61.8% level, with stop losses placed slightly below the level that is the limit of the trend structure.
- Additional confirmation can be obtained by matching Fibonacci levels with other indicators such as moving averages or previous high/low areas.
3. Moving Averages: Determining Dynamic Trends and Support
Moving averages are technical indicators that help traders recognize the direction of market trends by filtering out short-term price fluctuations. In addition, moving averages can also serve as dynamic support in an uptrend or resistance in a downtrend.
The EMA (Exponential Moving Average) type is more responsive to recent price changes, suitable for short-term trading, while the SMA (Simple Moving Average) gives a slower and broader picture of the trend.
How to use by professionals:
- Trend filter: If the price is above the 200 MA line, it indicates an upward trend (bullish). Conversely, if the price is below the 200 MA, it indicates a downtrend (bearish).
- Entry on pullback: In an uptrend, a price correction to the 20 MA or 50 MA can be a simple entry opportunity, with a stop loss placed slightly below the line.
Caution: Signals from moving average crossovers can be misleading in sideways or volatile markets, as they can produce false signals (whipsaws). Therefore, many traders confirm the trend direction on higher time frames before making decisions based on crossovers. This helps avoid the pitfalls of short-term movements that don’t continue.
4. Relative Strength Index (RSI): Reading Momentum and Range Shifts
RSI (Relative Strength Index) is a technical indicator that measures the strength of price momentum and helps identify overbought or oversold conditions. In a strong uptrend, the RSI tends to stay above the 40-50 level.
Read also: GameFi Starts to Rise in 2026: These 3 Crypto Lead the Rally Trend!
Conversely, in a downtrend, the RSI often falls below 50-60. Noticing these shifts can give early clues about a potential reversal or trend continuation.
How to use by professionals:
- Range shift: In an uptrend, the RSI usually stays above 40-50. In a downtrend, the RSI tends to stay below 60.
- Divergence: If the price makes a new high but the RSI doesn’t follow suit and instead forms a lower high, this could be a sign that momentum is starting to weaken, especially as the price approaches resistance.
Notes: Don’t immediately go short just because the RSI is at a high level during a strong uptrend. Use the RSI as supporting context, not as the sole trigger for trading decisions.
5. MACD: Confirming Trend and Momentum
MACD (Moving Average Convergence Divergence) is a technical indicator that combines elements of trend and momentum in one tool, making it very useful for recognizing changes in market strength. When the MACD line cuts the signal line from bottom to top near the zero line, it can signal the start of bullish momentum.
Conversely, if the MACD line cuts downwards, it could indicate bearish pressure. The MACD histogram helps visualize these changes, showing whether momentum is strengthening or weakening.
How to use by professionals:
- Breakout confirmation: Use MACD to confirm a breakout from the squeeze condition of the Bollinger Bands. When the MACD rises above the zero line accompanied by a strengthening histogram, it supports a long position in a bullish market.
- Support short positions: In a downtrend, a MACD dip below the zero line can reinforce the idea of going short, especially if the trend and volume are favorable.
Tip: Combine MACD with trend filters like the 200 EMA and price structure. Let the volume confirm the trigger candle before taking a position.
Follow us on Google News to stay up to date with the latest in crypto and blockchain technology. Check Bitcoin price, usdt to idr and tokenized nvidia stock price through Pintu Market.
Enjoy an easy and secure crypto trading experience by downloading the Pintu crypto app via Play Store or App Store now. Also, experience web trading with advanced trading tools such as pro charting, various types of order types, and portfolio tracker only at Pintu Pro.
*Disclaimer
This content aims to enrich readers’ information. Pintu collects this information from various relevant sources and is not influenced by outside parties. Note that an asset’s past performance does not determine its projected future performance. Crypto trading activities are subject to high risk and volatility, always do your own research and use cold hard cash before investing. All activities of buying and selling Bitcoin and other crypto asset investments are the responsibility of the reader.
Reference:
- Mudrex. What Are the Best Professional Crypto Futures Trading Indicators? Accessed on January 23, 2026
Berita Terbaru
© 2026 PT Pintu Kemana Saja. All Rights Reserved.
Kegiatan perdagangan aset crypto dilakukan oleh PT Pintu Kemana Saja, suatu perusahaan Pedagang Aset Keuangan Digital yang berizin dan diawasi oleh Otoritas Jasa Keuangan serta merupakan anggota PT Central Finansial X (CFX) dan PT Kliring Komoditi Indonesia (KKI). Kegiatan perdagangan aset crypto adalah kegiatan berisiko tinggi. PT Pintu Kemana Saja tidak memberikan rekomendasi apa pun mengenai investasi dan/atau produk aset crypto. Pengguna wajib mempelajari secara hati-hati setiap hal yang berkaitan dengan perdagangan aset crypto (termasuk risiko terkait) dan penggunaan aplikasi. Semua keputusan perdagangan aset crypto dan/atau kontrak berjangka atas aset crypto merupakan keputusan mandiri pengguna.