Download Pintu App
ETH Touches $2,000 Today, Hinting That Downside Pressure May Be in Its Late Stages
Jakarta, Pintu News – Ethereum (ETH) price has started March under pressure. Amid rising global tensions and weakening risk appetite, investors have started to review exposure to high-yielding assets like crypto. Currently, ETH is moving closer to the structural support area that has underpinned the macro uptrend for almost five years.
At the same time, on-chain data shows that whale wallets are starting to enter into unrealized losses. This kind of signal has, historically, appeared more often when the market is approaching a bottom than as an early sign of a sustained long decline.
Thus, the key question is: is this Ethereum price “crash” the beginning of a deeper decline, or is it the final phase of a correction before entering a recovery period? A number of indicators suggest that this is more than just a momentary dip.
Ethereum Price Up 4.10% in 24 Hours
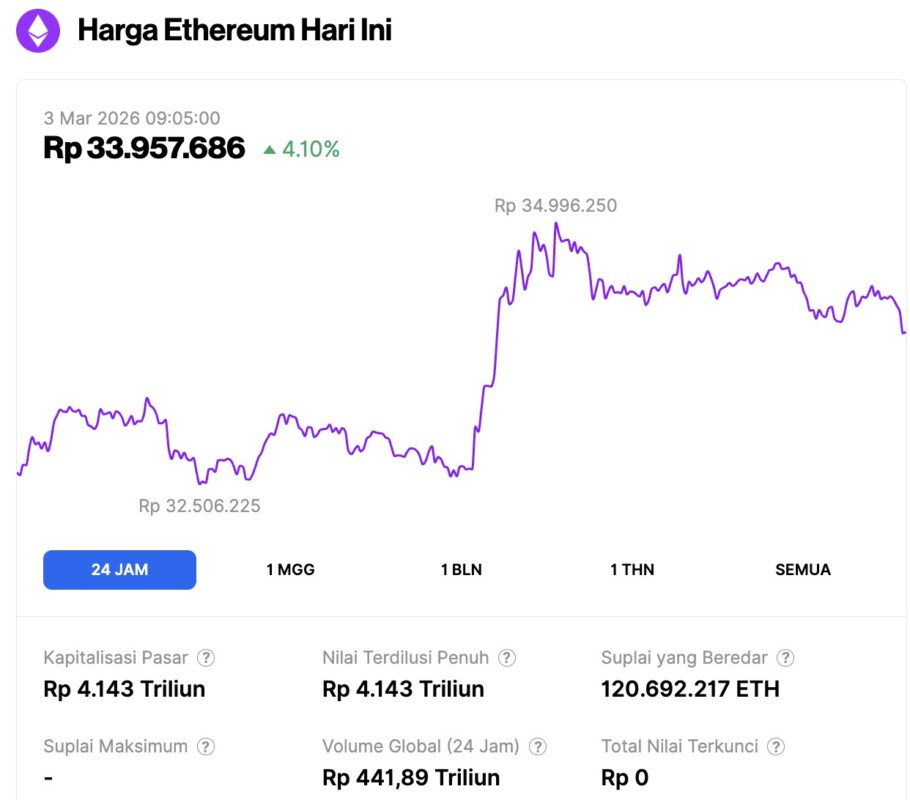
On March 3, 2026, Ethereum was trading at around $2,012, or approximately IDR 33,957,686, up 4.10% over the past 24 hours. Within that window, ETH dipped to a low of IDR 32,506,225 and climbed to a high of IDR 34,996,250.
At the time of writing, Ethereum’s market capitalization was estimated at roughly IDR 4,143 trillion. Meanwhile, 24-hour trading volume increased 16% to about IDR 441.89 trillion.
Read also: Bitcoin Price Rises to $68,000 Today: BTC Selling Pressure Now Decreasing?
Whale’s Unrealized Losses Turn Negative: Signal of Pressure in the Late Phase of the Cycle
On-chain analytics monitoring Ethereum addresses with holdings of 1,000 to 10,000 ETH show the unrealized profit ratio has dropped to below zero. This means a significant portion of large holders are now in a “boncos” position relative to their average cost basis.
Historically, whale conditions with unrealized gains remaining negative often appear in the period:
- Macro baseline 2018-2019
- Capitulation phase 2022
- Market “flush” events with high stress levels
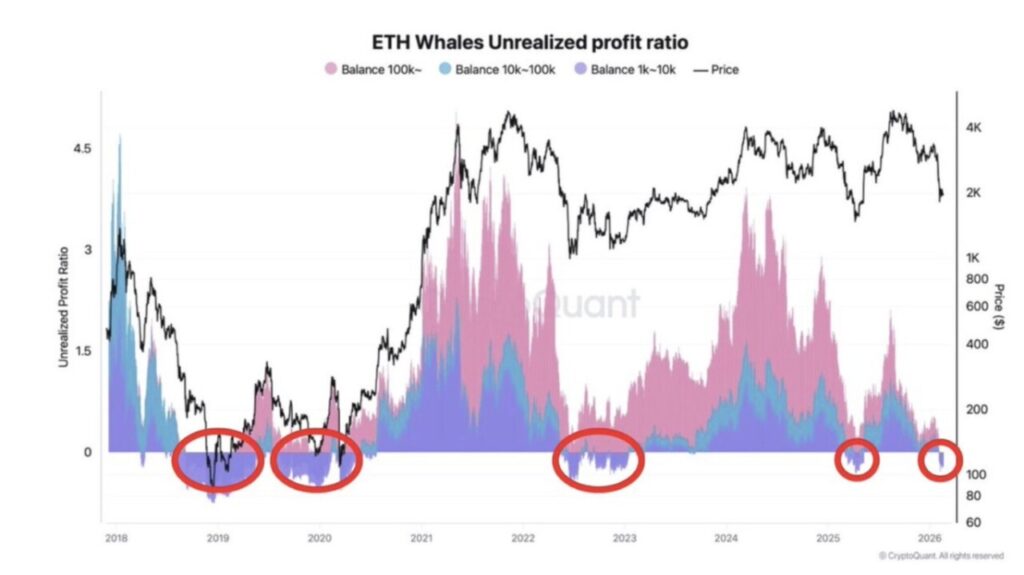
When whales enter loss territory, it generally reflects a late-stage correction rather than the beginning of a deeper trend breakdown. Large holders rarely make aggressive distributions when their positions are still well below cost basis.
Conversely, this phase often signals the exhaustion of weaker players, while the “strong hands” begin to stabilize positions. The current reading indicates Ethereum is entering a zone of high pressure which, historically, is often associated with inflection points.
However, this cannot be taken as confirmation that the market has bottomed. However, the data suggests that structural pressures are mounting.
Ethereum Price Tests Five-Year Structural Support: What Does It Mean for ETH?
From a technical standpoint, Ethereum price is compressing around an ascending monthly trendline, which since the reset of the previous cycle has served to support the overall macro structure. This trendline previously served as:
- Long-term accumulation base
- Correction floor when a large drawdown occurs
- The foundation for a sustained upward phase
Read also: Solana Price Prediction March 2026: Will SOL Price Fall to $59?
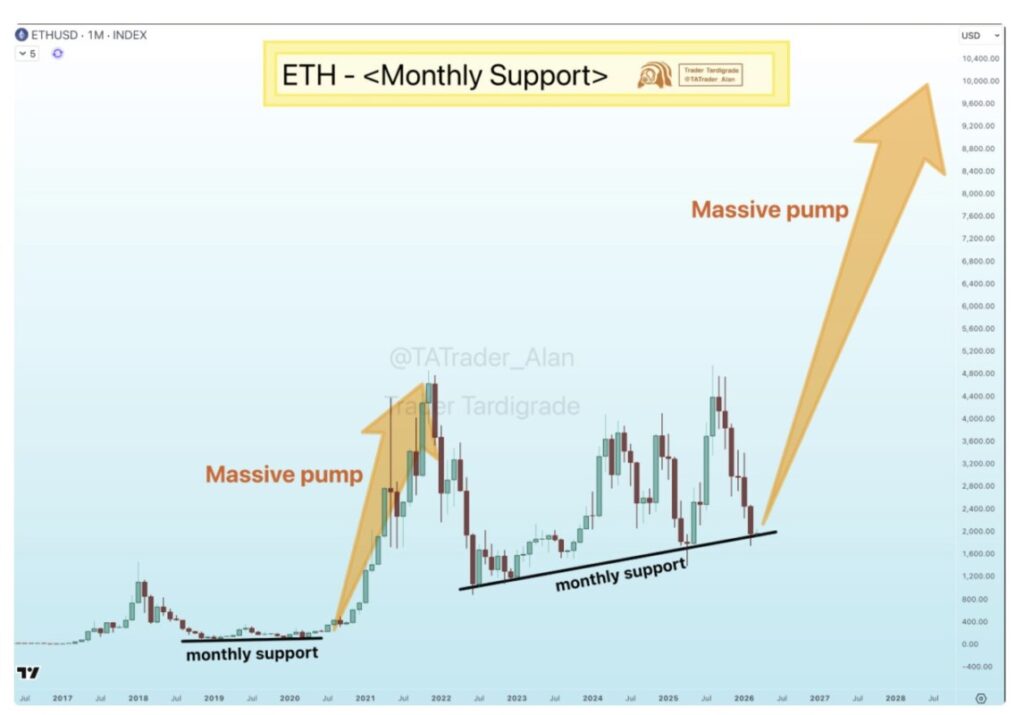
Importantly, ETH has not shown any impulsive breakout below this support area. Instead, the price action shows a tightening consolidation just above this level. Compression in areas of structural support differs significantly from breakdowns.
In the event of a confirmed monthly candle close below the trendline, Ethereum’s “crash” narrative will strengthen and potentially open up room for a deeper retracement. But as long as these levels remain intact, the technical macro structure can still be considered intact.
Macro Conditions Add Pressure on Ethereum Price Outlook
The broader market backdrop remains fragile. Rising geopolitical tensions and reduced liquidity in global markets drove volatility higher in risky assets.
On the other hand, crypto derivatives positioning reflects this caution. Funding rates are trending neutral to negative, which indicates speculative interest in long positions is cooling, not growing.
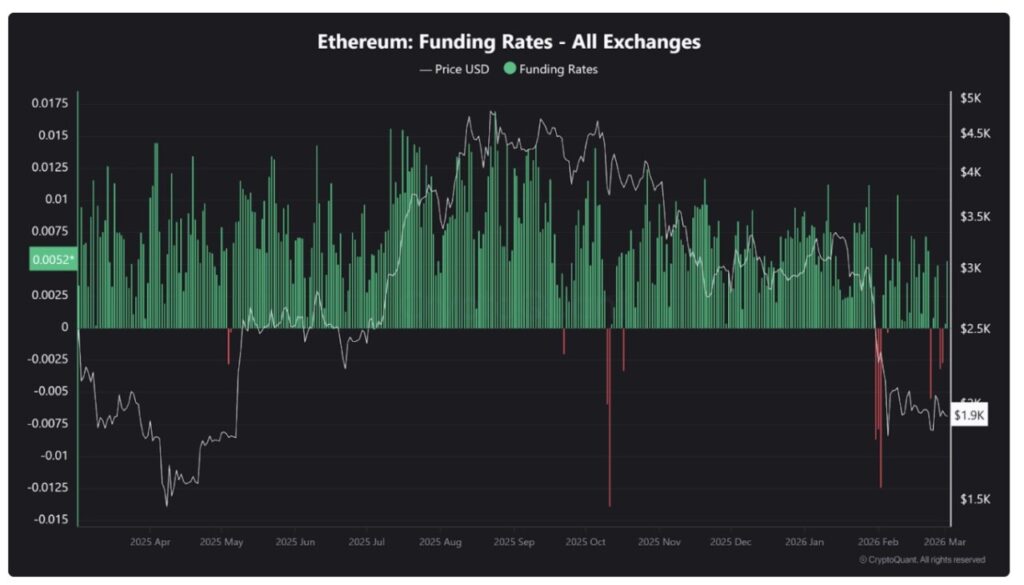
Such conditions are generally aligned with a defensive strategy, rather than excessive euphoria. Historically, large bottom formation often occurs when:
- Weak sentiment
- Flushed leverage
- Large holders absorb volatility
Ethereum’s current configuration is closer to that pattern than the euphoria characteristic of the early phase of a bull cycle. As such, Ethereum price needs to hold its five-year structural support to ward off a deeper “crash” scenario. For now, Ethereum is at a macro crossro.
On the upside, a successful retake of the near-term resistance zone at $2,200 would signal a re-emergence of strength and shift the short-term momentum towards a recovery phase.
On the downside, a decisive break below the $1,700 macro support zone could pave the way towards the deeper historical demand area around $1500, while reinforcing the narrative of a sharp decline in Ethereum prices.
Follow us on target="_blank" rel="noreferrer noopener" href="https://news.google.com/u/2/publications/CAAqBwgKMKXoywsw1YPjAw?hl=id&gl=ID&ceid=ID%3Aid">Google News to stay up to date with the latest in crypto and blockchain technology. Check Bitcoin price, usdt to idr and tokenized nvidia stock price through Pintu Market.
Enjoy an easy and secure crypto trading and crypto gold investment experience by downloading the Pintu crypto app via Play Store or App Store now. Also, experience web trading with advanced trading tools such as pro charting, various order types, and portfolio tracker only at Pintu Pro.
*Disclaimer
This content aims to enrich readers’ information. Pintu collects this information from various relevant sources and is not influenced by outside parties. Note that an asset’s past performance does not determine its projected future performance. Crypto trading activities are subject to high risk and volatility, always do your own research and use cold hard cash before investing. All activities of buying and selling Bitcoin and other crypto asset investments are the responsibility of the reader.
Reference:
- Coinpedia. Ethereum Price Crash or Cycle Bottom? Whale Data May Reveal the Truth. Accessed on March 3, 2026
Berita Terbaru
© 2026 PT Pintu Kemana Saja. All Rights Reserved.
Kegiatan perdagangan aset crypto dilakukan oleh PT Pintu Kemana Saja, suatu perusahaan Pedagang Aset Keuangan Digital yang berizin dan diawasi oleh Otoritas Jasa Keuangan serta merupakan anggota PT Central Finansial X (CFX) dan PT Kliring Komoditi Indonesia (KKI). Kegiatan perdagangan aset crypto adalah kegiatan berisiko tinggi. PT Pintu Kemana Saja tidak memberikan rekomendasi apa pun mengenai investasi dan/atau produk aset crypto. Pengguna wajib mempelajari secara hati-hati setiap hal yang berkaitan dengan perdagangan aset crypto (termasuk risiko terkait) dan penggunaan aplikasi. Semua keputusan perdagangan aset crypto dan/atau kontrak berjangka atas aset crypto merupakan keputusan mandiri pengguna.