Download Pintu App
Bitcoin Holds Steady at $68,000 as Three Catalysts Signal a Potential Bullish Turn
Jakarta, Pintu News – Bitcoin (BTC) is currently in a crucial phase after a prolonged decline. However, a number of macroeconomic and on-chain indicators indicate a strong reversal opportunity. In fact, many analysts are predicting a medium-term recovery that could last for several months.
Here are three main reasons why many analysts think this recovery scenario is quite strong. In advance, how will Bitcoin price move today?
Bitcoin Price Drops 0.15% in 24 Hours
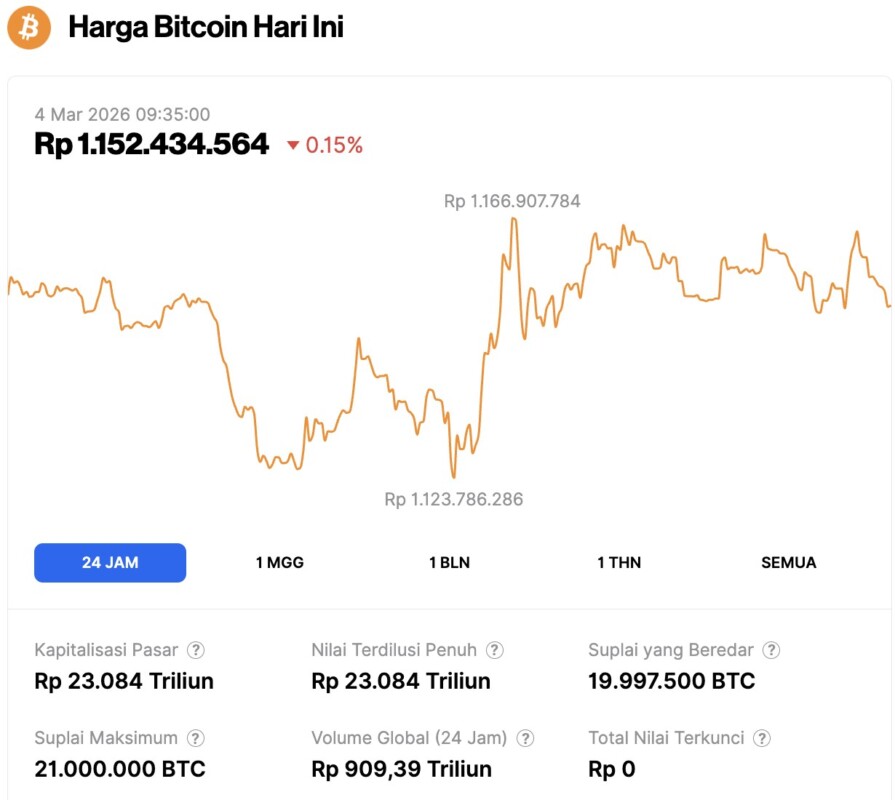
On March 4, 2026, Bitcoin was trading at $68,115, equal to IDR 1,152,434,564, after a modest 0.15% dip over the past 24 hours. Within that window, BTC moved between an intraday low of IDR 1,123,786,286 and a high of IDR 1,166,907,784.
At the time of writing, Bitcoin’s market capitalization is estimated at around IDR 23,084 trillion, while 24-hour trading volume slid 11% to IDR 909.39 trillion.
Read also: Steak ’n Shake Now Adds a Bitcoin Bonus to Hourly Pay
Correlation between Bitcoin and ISM Manufacturing PMI
Firstly, the US ISM Manufacturing PMI recorded expansion for the second consecutive month. Based on the latest report from the Institute for Supply Management (ISM), the February 2026 PMI stood at 52.4%. This was down slightly from 52.6% in the previous month, but still exceeded market expectations at 51.8%.
This marked the second consecutive reading above the 50 threshold, ending a roughly three-year period of US manufacturing contraction. The rise in the index is generally read as a signal of improving cyclical sentiment and increased investor risk tolerance, thus opening up space for capital flows towards riskier assets, including Bitcoin.
Analyst Joe Consorti also highlighted the relationship of this index movement with Bitcoin price dynamics in previous cycles. He believes that the current configuration is consistent with the possibility of a trend reversal. He added that, historically, phases like this often coincide with the early stages of the Bitcoin bull market, with the exception of 2022.
Bitcoin’s Inter-Exchange Flow Pulse Indicates a Change in Sentiment
Secondly, CW analysts think that Bitcoin’s Inter-Exchange Flow Pulse (IFP) indicator has the potential to form a “golden cross” in the near future, which is often read as a signal of a shift in market sentiment.
According to CryptoQuant, an on-chain data analytics platform, IFP measures the flow of Bitcoin movement between spot exchanges and derivatives exchanges. This flow data is used to capture the psychological tendencies of the market. When the volume of Bitcoin moving to derivatives exchanges increases, the indicator generally points to a bullish phase, as market participants move coins to open long positions in the derivatives market.
Conversely, when Bitcoin flows move from derivatives exchanges towards spot exchanges, the indicator usually indicates the beginning of a bearish phase. This often corresponds to the closing of long positions and large investors’ moves to lower risk exposure.
Read also: Iran Conflict Heats Up: Here are 2 Stocks at Risk of Weakening This Week
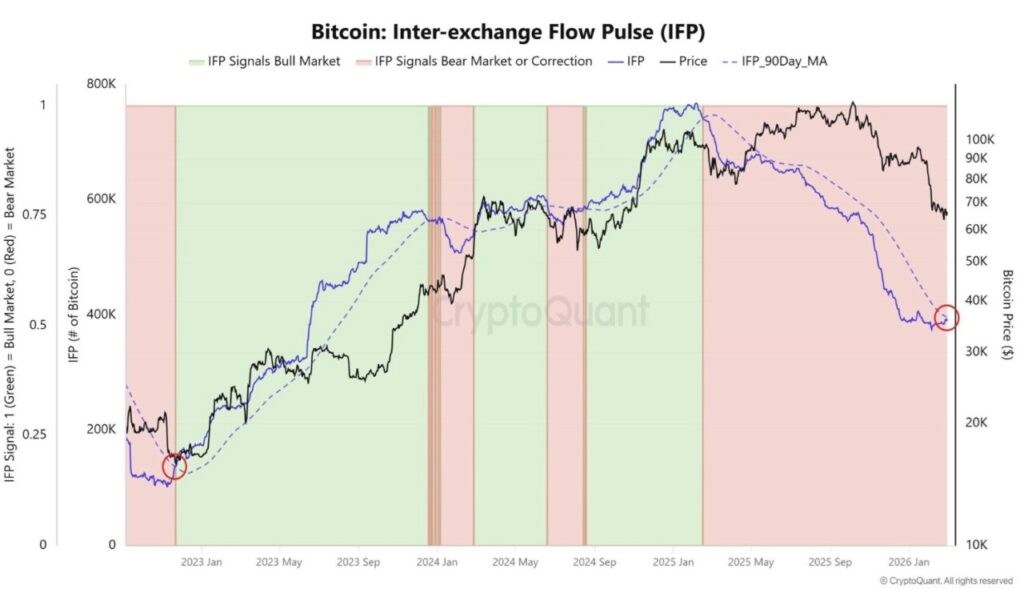
Historically, similar signals have appeared before the strong recovery in the period 2023 to 2025. Now, after about a year of correction phase, the appearance of the golden cross is considered imminent. If the cross is confirmed, the interpretation would be the possible start of a new bullish cycle for Bitcoin.
CW stated that the golden cross on Bitcoin’s IFP is very close, and after a year of correction, the price is considered to have room to rise again.
Five Consecutive Monthly Red Candles Indicate Weakening Selling Pressure
Third, the occurrence of five consecutive monthly red candles is extremely rare. Bitcoin closed February 2026 with its fifth consecutive monthly red candle, and this is only the second time in history that such a sequence has been recorded.
The first incident took place in the 2018-2019 period, when Bitcoin had posted six consecutive monthly red candles. After that phase, Bitcoin scored five consecutive monthly green candles, and then its price jumped more than 300% from around $3,400 to $14,000.
Although the number of historical samples is still limited, a long series of red candles is generally read as a signal that selling pressure is approaching saturation point. A strong reversal may occur when buying demand picks up again.
Analyst Satoshi Flipper emphasized that the debate on whether the series amounted to five or six red candles is no longer crucial, as most of the decline is judged to have already occurred, while the upside potential is still open.
Historically, this combination of signals often confirms an upward trend that lasts several months. A recent report from the BeInCrypto website also reinforces the scenario that Bitcoin is entering a base formation phase, although some analysts still think there is a possibility of further decline.
Follow us on target="_blank" rel="noreferrer noopener" href="https://news.google.com/u/2/publications/CAAqBwgKMKXoywsw1YPjAw?hl=id&gl=ID&ceid=ID%3Aid">Google News to stay up to date with the latest in crypto and blockchain technology. Check Bitcoin price, usdt to idr and tokenized nvidia stock price through Pintu Market.
Enjoy an easy and secure crypto trading and crypto gold investment experience by downloading the Pintu crypto app via Play Store or App Store now. Also, experience web trading with advanced trading tools such as pro charting, various order types, and portfolio tracker only at Pintu Pro.
*Disclaimer
This content aims to enrich readers’ information. Pintu collects this information from various relevant sources and is not influenced by outside parties. Note that an asset’s past performance does not determine its projected future performance. Crypto trading activities are subject to high risk and volatility, always do your own research and use cold hard cash before investing. All activities of buying and selling Bitcoin and other crypto asset investments are the responsibility of the reader.
Reference:
- BeInCrypto. Why Bitcoin Could Enter a Multi-Month Uptrend. Accessed on March 4, 2026
Berita Terbaru
© 2026 PT Pintu Kemana Saja. All Rights Reserved.
Kegiatan perdagangan aset crypto dilakukan oleh PT Pintu Kemana Saja, suatu perusahaan Pedagang Aset Keuangan Digital yang berizin dan diawasi oleh Otoritas Jasa Keuangan serta merupakan anggota PT Central Finansial X (CFX) dan PT Kliring Komoditi Indonesia (KKI). Kegiatan perdagangan aset crypto adalah kegiatan berisiko tinggi. PT Pintu Kemana Saja tidak memberikan rekomendasi apa pun mengenai investasi dan/atau produk aset crypto. Pengguna wajib mempelajari secara hati-hati setiap hal yang berkaitan dengan perdagangan aset crypto (termasuk risiko terkait) dan penggunaan aplikasi. Semua keputusan perdagangan aset crypto dan/atau kontrak berjangka atas aset crypto merupakan keputusan mandiri pengguna.