How to Trade Using a Shooting Star Candle Pattern

Shooting star candles pattern are a popular chart pattern used in technical analysis to identify potential reversals in price movements. Shooting star candles can be identified through the shape of the candle and the location where it appears. Want to know how to identify a shooting star candle and how to use it? Find out in the following article.
Article Summary
- 🌐 Shooting star candle pattern is a type of candlestick that gives a bearish signal, a potential change from an uptrend to a downtrend.
- 🌟 Shooting star candles can be identified through the shape of a candle with a short body followed by a very long upper wick. Meanwhile, the lower wick is very short or has no wick at all.
- 🔝 Shooting star candles can be found at the end or near the end of an uptrend.
- 🆚 Although they have the same shape, shooting star candles differ from inverted hammers. If it occurs at the end of an uptrend, then the candle is a shooting star. Whereas if it occurs at the end of a downtrend, the candle is an inverted hammer.
What is Shooting Star Candle Pattern?
Shooting star candles pattern are a type of candlestick that gives a bearish signal, a potential uptrend change into a downtrend. However, downtrend movements can occur in the long or short term. The shooting star candle pattern is usually seen when an asset price is at the highest price in an ongoing uptrend.
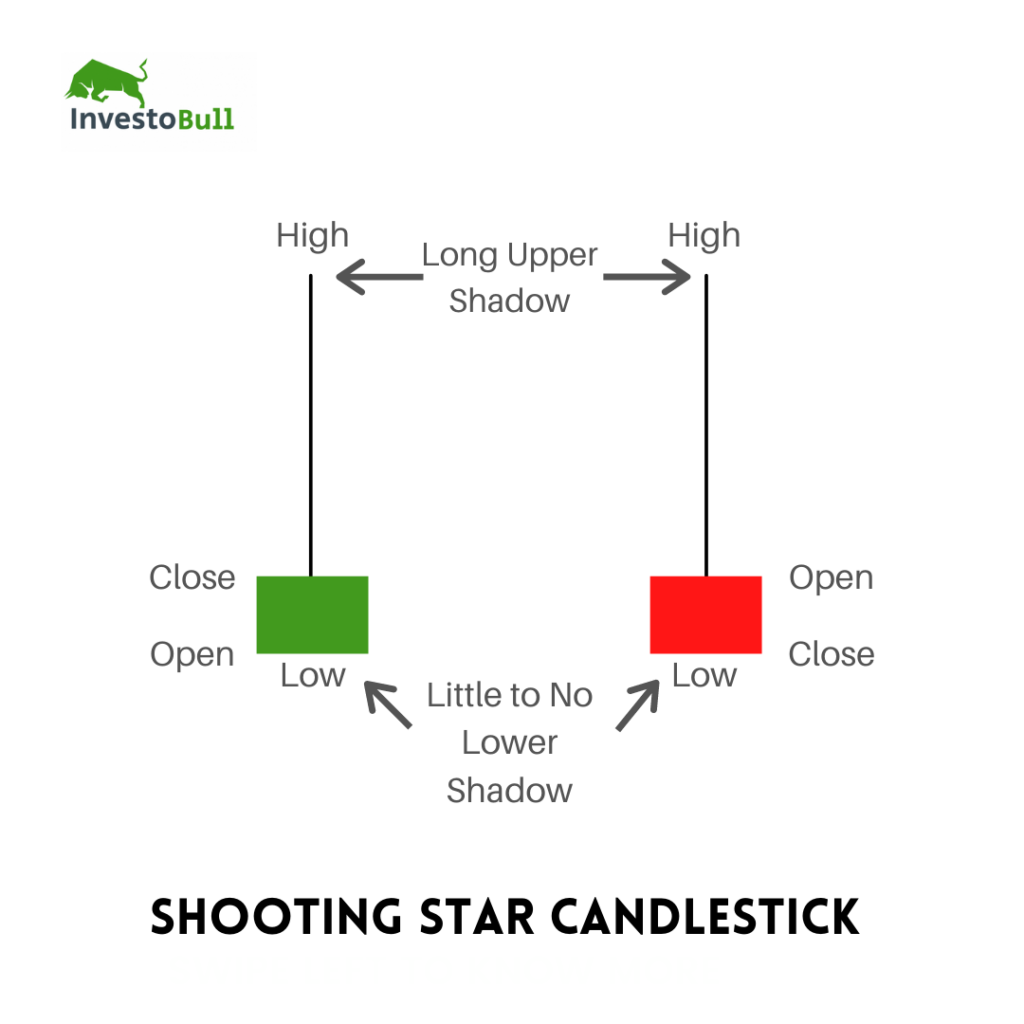
From its shape, the shooting star candle has characteristics that are easy to recognize. A shooting star is a single candle with a short body and a very long upper wick. Meanwhile, the lower wick is very short or has no wick at all.
To get a more accurate shooting star candle, the length of the upper wick should be at least double the size of the body.
A long wick indicates buyers were initially in control, pushing the asset price up. However, sellers later became more dominant, pushing the price back down. A short body, on the other hand, can mean that there was a slight price divergence during the session.
Remember, the body’s color on a shooting star candle doesn’t matter, whether the body is red or green. The most important factor to consider is when the candle appears when the asset price is at the top of an uptrend.
Beside a shooting star, find out another candlestick pattern in the following article.
How to Read a Shooting Star Candle Pattern
In reading shooting star candles, you must know when the candlestick appears. Shooting star candles only occur at the end of an uptrend. So it becomes meaningless if they appear in the middle of an uptrend or a downtrend. Furthermore, a confirmation candle is needed to make the shooting star more accurate.
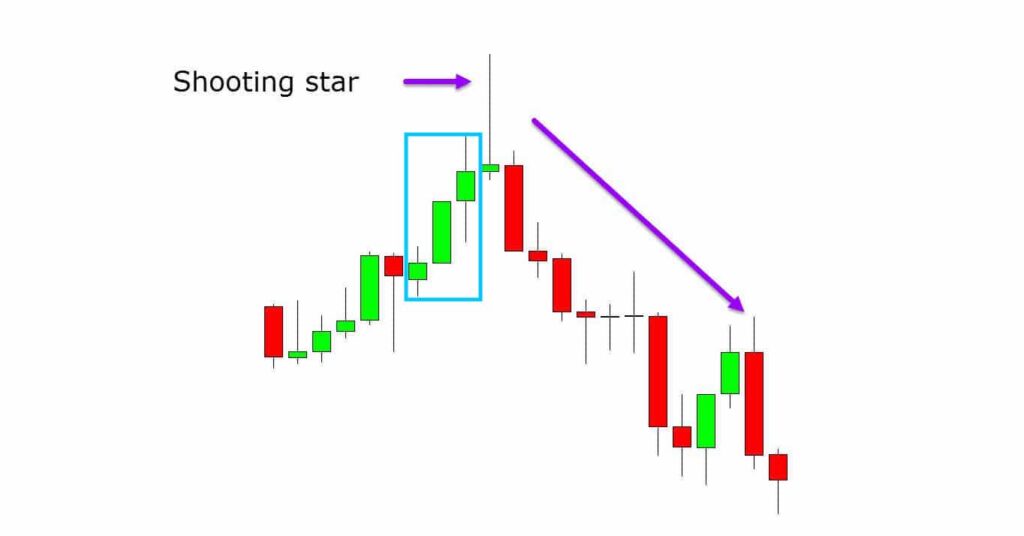
Two circumstances could be contributing factors. First, a shooting star candle appears after the formation of three consecutive bullish candles with higher highs. Second, the next candle has an opening price close to the closing price of the shooting star candle. The price also needs to move far down. Then, the candle must also have a high and closing price below the shooting star candle.
These two factors ensure that the price movement is experiencing a reversal. Then it will continue to drop in the next session. However, remember that the appearance of a shooting star does not necessarily imply that the uptrend will change to a downtrend. As mentioned earlier, the shooting star may give a short-term bearish signal. Thus, the correction may be only momentary and resume the uptrend.
Tips for Using the Shooting Star Candle Pattern
For traders who want to use shooting star candles as a signal to make investment decisions, the tip is to make sure there is a confirmation candle. The shooting star candle pattern has been confirmed when the next candle appears with a lower body and high.
For traders or investors who want to go long, it is better to wait to buy the asset. The reason is there is a possibility that the asset will experience a trend reversal and correct. Meanwhile, traders who already have a position can take a profit or cut losses to reduce the risk of more significant losses.
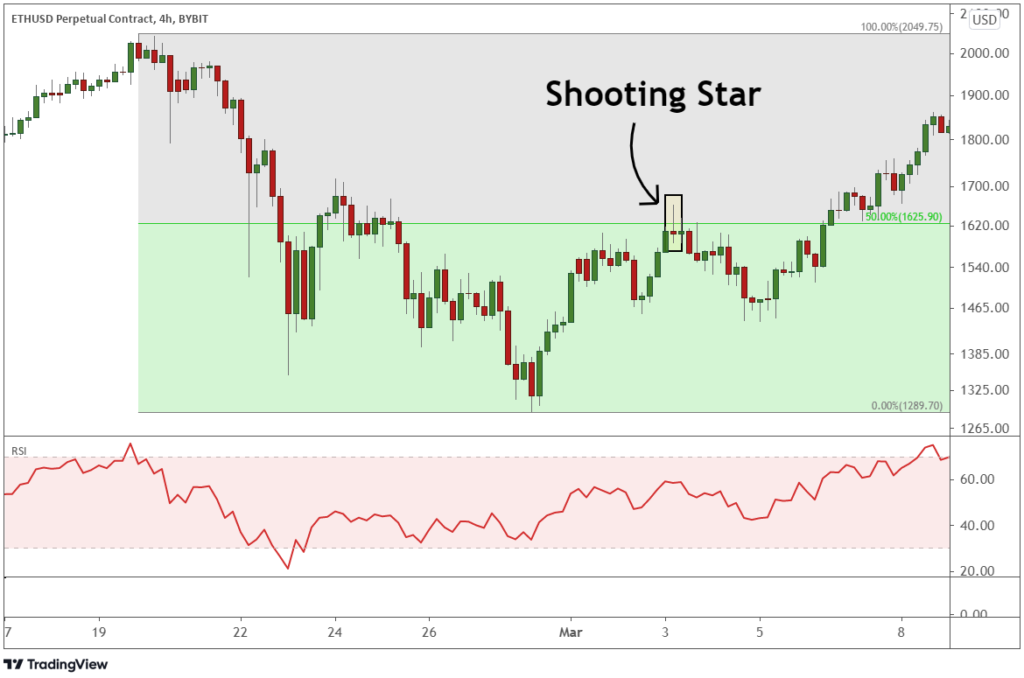
Then, for traders who want to place a short, a confirmed shooting star candle can be a potential entry point. This is because the asset price will experience a downtrend. But traders should consider other factors such as the overall trend, volume, support, and resistance level.
In general, shooting star candles can be a useful technical analysis to identify possible trend reversals. However, it’s much better when traders combine shooting star candles with other technical indicators to get more reliable signals.
Find out how to do technical analysis in cryptocurrency in the following article.
Advantages and Disadvantages of Shooting Star Candle Pattern
The following are the advantages of shooting star candle:
- Easy to identify. As a single candlestick makes shooting star candles easy to identify. Traders simply look for a small-body candle with a very long upper wick at the end of an uptrend.
- Suitable for beginners. Since shooting star candles are easy to identify, this candlestick is suitable for beginners. However, professional traders can still use this indicator to look for confirmation of trend reversals.
The following are the disadvantages of shooting star candle:
- Additional indicators are needed. The shooting star must be followed by a confirmation candle to confirm a trend reversal. However, even with a confirmation candle, the reversal trend can be predicted to be long-term or short-term. Traders must also consider other analytical data, such as moving averages, volume indicators, and other candlestick patterns.
The Difference Between Shooting Star Candle and Inverted Hammer
Some traders may think a shooting star candle is an inverted hammer and vice versa. The reason is both do have a very long upper wick with a small body. Then both also have a very short or no lower wick at all.
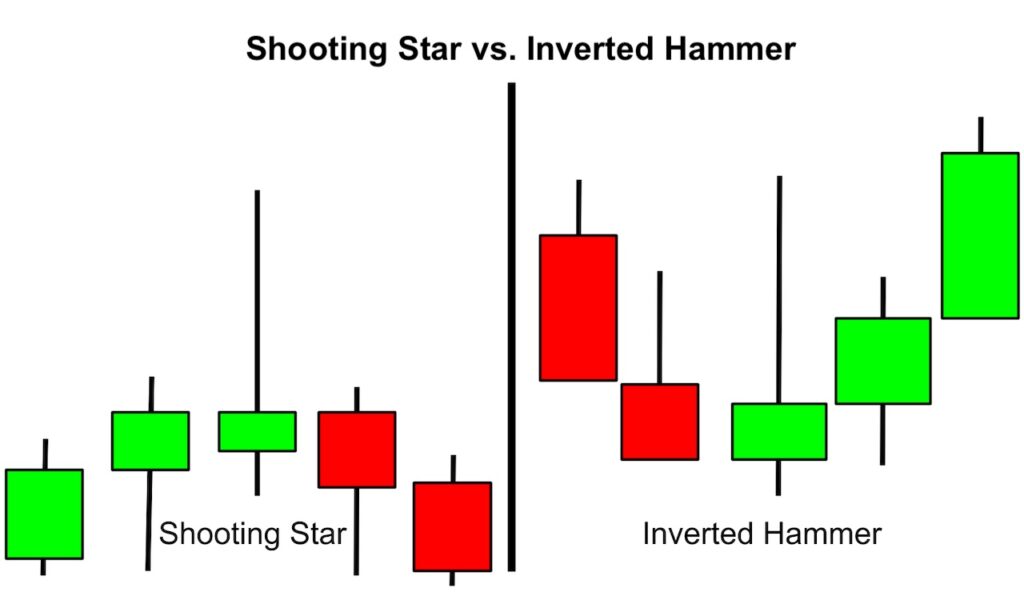
In fact, both have significant differences and are easily identifiable. The main difference is where each candle forms. Shooting star candles form at the end or near the end of an uptrend. In comparison, inverted hammer candles form at the end or near the end of a downtrend.
As the place where each candle forms differs, so is the signal it gives. Shooting star candles can be identified as a sign of a reversal from an uptrend to a downtrend. Meanwhile, the inverted hammer candle can be identified as a sign of reversal from a downtrend to an uptrend.
Learn about the various crypto price chart patterns you should know about.
Buy Crypto Assets in Pintu
Interested in investing in crypto assets? Take it easy, you can buy various crypto assets such as BTC, ETH, SOL, and others safely and easily. Furthermore, Pintu has subjected all its crypto assets to a thorough evaluation process, emphasizing the importance of prudence.
Pintu is also compatible with popular wallets such as Metamask to facilitate your transactions. Download Pintu app on Play Store and App Store! Your security is guaranteed because Pintu is regulated and supervised by Bappebti and Kominfo.
In addition to executing transactions, in the Pintu Apps, you can also learn more about crypto through various Pintu Academy articles updated weekly! All Pintu Academy articles are made for knowledge and educational purposes, not as financial advice.
Referensi
Warren Venketas, How to Trade Shooting Star Candlestick Patterns, Daily FX, accessed on 3 April 2023.
Cory Mitchell, Shooting Star: What It Means in Stock Trading, With an Example, Investopedia, accessed on 3 April 2023.
Forexpedia, Shooting Star, Baby Pips, accessed on 3 April 2023.
Share
Table of contents

