Download Pintu App
Hedera (HBAR) Price Prediction in November 2025
Jakarta, Pintu News – Entering November, Hedera (HBAR) traders are facing mixed expectations. In the past three months, HBAR has seen a decline of 32.6%, weighed down by broader market caution.
However, the price history of HBAR suggests that the next few weeks may be different. November has been one of the best months for Hedera, with significant gains in previous years. Here are HBAR’s November price predictions according to Ananda Banerjee, crypto analyst at BeInCrypto!
Strong History, Weak Support
Although Hedera (HBAR) has a strong historical record of rising in November, this year it lacks a critical element – support from large investors. The Chaikin Money Flow (CMF) indicator, which measures the flow of capital in or out of the market, shows a reading of -0.13 on the daily chart.
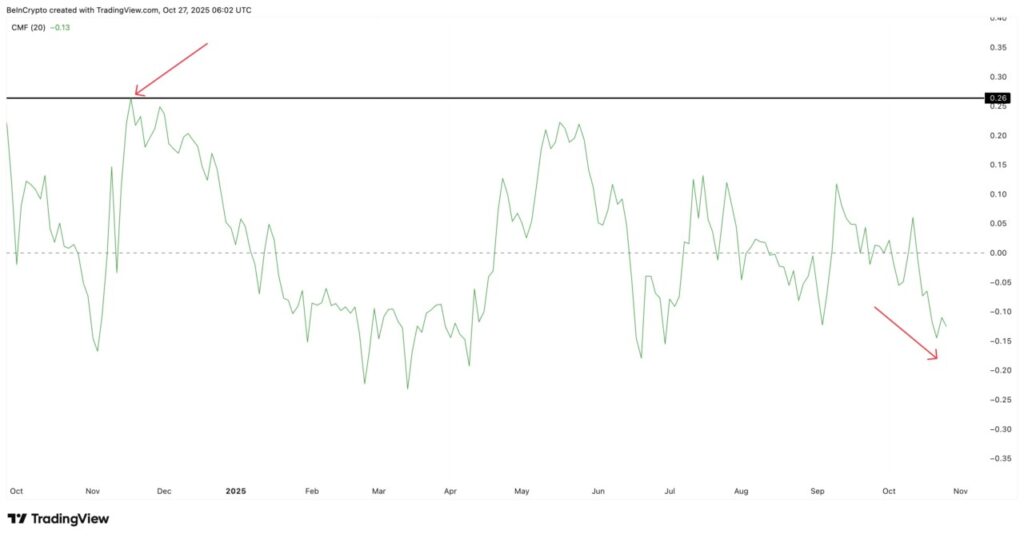
This signals that capital is being pulled out, in contrast to November last year when the CMF reached +0.26, indicating heavy buying by institutions. Nonetheless, HBAR’s long-term data shows an average gain in November of 41%. This maintains optimism, especially if macro conditions become favorable after the Federal Reserve (Fed) meeting.
Read also: x402 Token: Revolutionizing Payments for AI Agents
Potential Short Position Squeeze
While support from large investors remains minimal, the derivatives market is showing increased activity. According to Bitget’s liquidation map, short positions have accumulated around $37.94 million, while long positions amounted to $23.78 million.
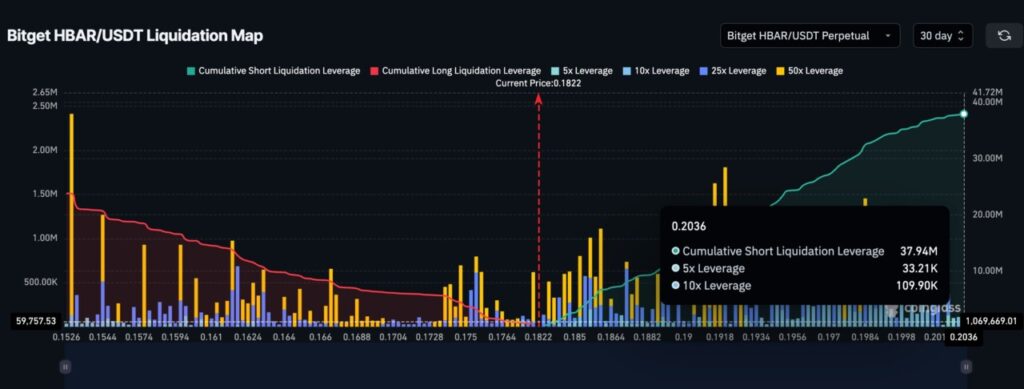
If prices rise slightly after the FOMC meeting, especially if the Fed confirms a dovish tone or rate cut, this could trigger a short position squeeze, forcing bearish traders to buy back into the market. This derivatives-led rally could trigger a quick move towards $0.22 or even $0.26. This latter rise would mark a gain of up to 44% from current levels.
Read also: 4 US Economic Events that Affect Crypto Markets This Week
Price Indications and Divergence
On the two-day chart, HBAR is still moving inside a symmetrical triangle pattern, a neutral pattern that often leads to a major breakout or breakdown after the price breaks out of the range. However, between October 12 and October 26, the price registered lower peaks, while the Relative Strength Index (RSI) formed higher peaks.
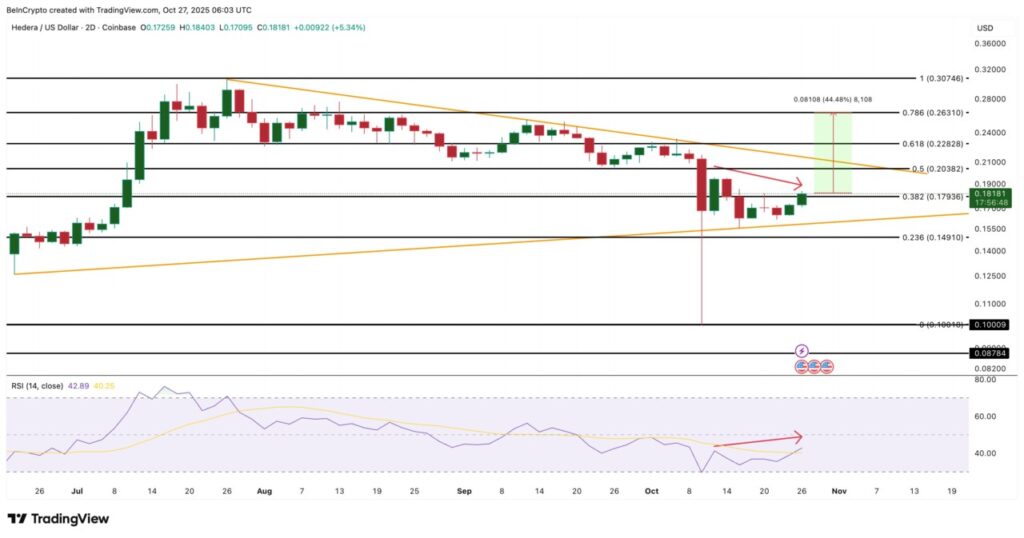
This is known as a hidden bearish divergence, which usually signals that the existing downward trend could continue. However, the RSI which is currently near 43, is in a zone where a reversal could easily form, especially if there is an external trigger. If HBAR closes above $0.20, the upper limit of the triangle is broken, and targets of $0.22 and $0.26 (44% upside) open up.
Conclusion
The overall setup for November suggests that derivatives, not buying by large investors, could determine the next move for HBAR. Although November has historically relied on large fund inflows, with CMF still negative, the support is yet to arrive.
If the liquidation of short positions starts piling up after the dovish signal from the FOMC, a short-term rally above $0.20 could happen quickly. However, if the Fed disappoints or the divergence deepens, a drop towards $0.14 remains possible before HBAR price recovery.
That’s the latest information about crypto. Follow us on Google News to get the latest crypto news about crypto projects and blockchain technology. Also, learn crypto from scratch with complete discussion through Pintu Academy and stay up-to-date with the latest crypto market such as bitcoin price today, xrp coin price today, dogecoin and other crypto asset prices through Pintu Market.
Enjoy an easy and secure crypto trading experience by downloading Pintu crypto app via Google Play Store or App Store now. Also, get a web trading experience with various advanced trading tools such as pro charting, various types of order types, and portfolio tracker only at Pintu Pro.
*Disclaimer
This content aims to enrich readers’ information. Pintu collects this information from various relevant sources and is not influenced by outside parties. Note that an asset’s past performance does not determine its projected future performance. Trading crypto carries high risk and volatility, always do your own research and use cold hard cash before investing. All activities of buying and selling bitcoin and other crypto asset investments are the responsibility of the reader.
Reference
- BeInCrypto. Hedera (HBAR) Price Outlook for November. Accessed on October 28, 2025
- Featured Image: The Daily Hodl
Berita Terbaru
© 2026 PT Pintu Kemana Saja. All Rights Reserved.
Kegiatan perdagangan aset crypto dilakukan oleh PT Pintu Kemana Saja, suatu perusahaan Pedagang Aset Keuangan Digital yang berizin dan diawasi oleh Otoritas Jasa Keuangan serta merupakan anggota PT Central Finansial X (CFX) dan PT Kliring Komoditi Indonesia (KKI). Kegiatan perdagangan aset crypto adalah kegiatan berisiko tinggi. PT Pintu Kemana Saja tidak memberikan rekomendasi apa pun mengenai investasi dan/atau produk aset crypto. Pengguna wajib mempelajari secara hati-hati setiap hal yang berkaitan dengan perdagangan aset crypto (termasuk risiko terkait) dan penggunaan aplikasi. Semua keputusan perdagangan aset crypto dan/atau kontrak berjangka atas aset crypto merupakan keputusan mandiri pengguna.