Market Analysis Oct 16th, 2023: BTC Support at $25,700

The expected “Uptober” for crypto investors seems to be out of reach in the near future. This is evident from the macroeconomic data, which has yet to find supporting factors capable of driving the crypto market in a positive direction. In addition, Bitcoin has once again encountered the 200-week moving average (MA) resistance line, after trading below it for 8 consecutive weeks. So, what macroeconomic factors are making the crypto market more bearish? Explore the analysis below.
The Pintu trading team has gathered critical information and analyzed the general economic situation and the crypto market’s movements over the past week. However, it should be noted that all information in this Market Analysis is intended for educational purposes, not as financial advice.
Market Analysis Summary
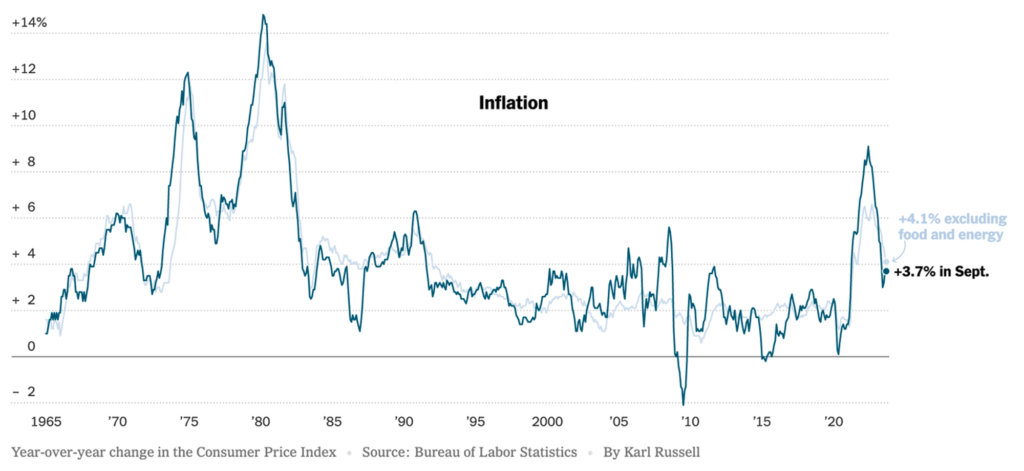
- ✍🏻 On an annual basis, the inflation rate in the United States (US) increased by 3.7% year-on-year. Meanwhile, core inflation eased to 4.1% from 4.3%.
- 🦾 The U.S. labor market showed a strong performance, adding 336,000 jobs in September, almost double the expected 170,000 new jobs.
- 📉 BTC is trading at resistance levels of $27,000 and $27,400. ETH has breached the 200-week support line and is expected to fall further.
Macroeconomic Analysis
Unemployment Rate
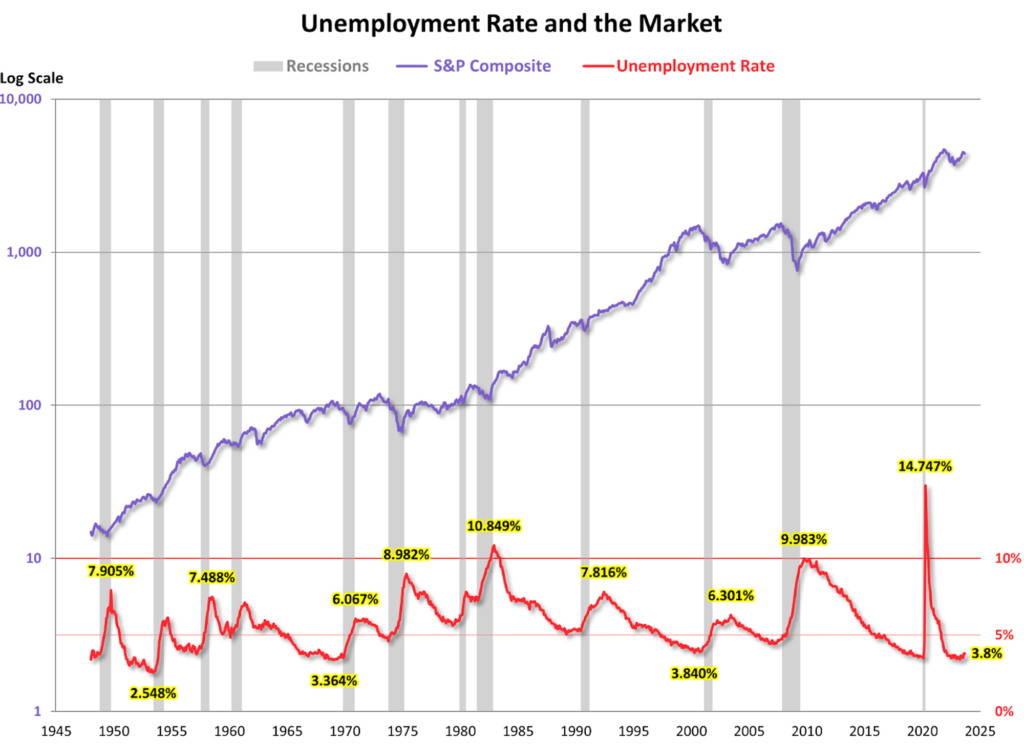
The current unemployment rate is 3.787%, which is the highest unemployment rate since February 2022. The chart below illustrates the historical trend of the unemployment rate, economic recessions, and the S&P Composite Index since 1948.
The unemployment rate serves two purposes: it acts as a lagging indicator and it moves inversely with stock prices. The chart below shows its correlation with the two functions of the unemployment rate, which occurred in 1971, 1975, and 1982, consistent with previous bear markets. Even in the most recent case, during the early stages of the Covid, stocks and unemployment had a similar relationship, albeit temporarily.
U-6 Unemployment Rate
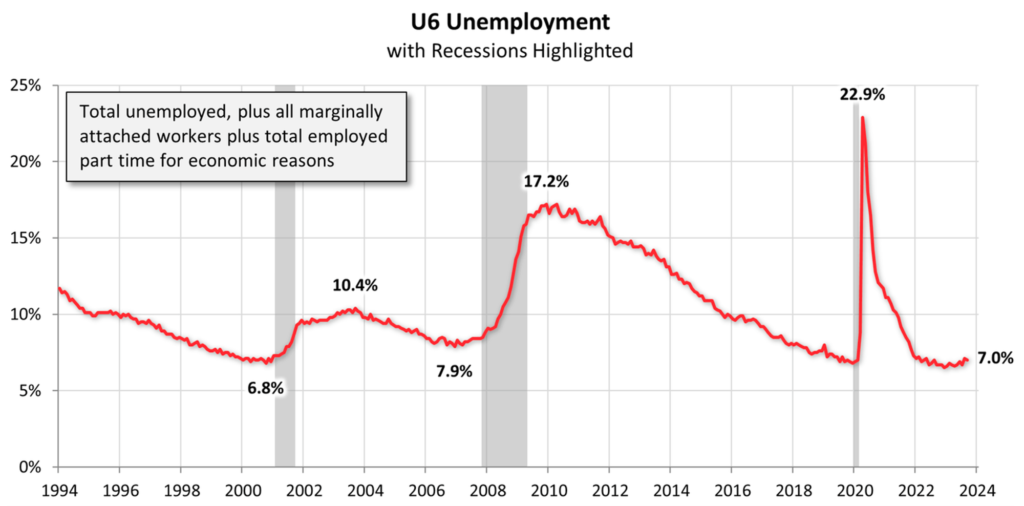
This is one of the most comprehensive measures of the unemployment rate. The U.S. Bureau of Labor Statistics introduced the U6 series in 1994. The U6 series measures not only the number of people who are unemployed, but also includes those who are marginally attached to the labor force. The U6 series is currently at 7.0%, down only slightly from last month’s 7.1%.
The unemployment rate is currently holding steady at 3.8%. However, employment figures show that 336,000 jobs were added in September, nearly double the 170,000 expected. Job gains were seen in leisure and hospitality, government, health care and social assistance, and professional and scientific services.
The widespread hiring across sectors represents the most significant expansion in U.S. employment in the past eight months. The robust performance of the labor market provides potential for the Fed to continue raising interest rates, despite signs of slowing wage growth.


Monthly net job creation averaged 266,000 in the third quarter, up sharply from 201,000 in the second quarter.
A strong surge in hiring led to a near doubling of non-farm payrolls in September compared to economists’ forecasts. In addition, employment figures for July and August were revised upward, with 236,000 and 227,000 jobs added in those months, respectively.
Official data has shown a recent slowdown in job growth, while the Fed continues to fight inflation. Nevertheless, the labor market remains resilient and supports optimism that the central bank can successfully steer the U.S. economy toward a soft landing characterized by normal price growth and recession avoidance.
Nonfarm Private Payrolls
Private payrolls increased by 263,000 jobs. Some economists argue that the wage increase was influenced by challenges in accounting for the return of workers in the education sector.

United States Department of the Treasury (US Treasury)
Long-term US bond yields have surged to their highest levels in the last 16 years, prompting a decline in major stock indices on Wall Street. This indicator, which most economists predict, implies that the Fed might be done with interest rate hikes. However, from an investor standpoint, evaluations continue regarding the possibility of the Fed raising interest rates in the coming months.
Previously, Jerome Powell acknowledged the possibility of a “soft landing” but did not consider it the most likely outcome. Powell indicated that there are factors beyond the Fed’s control, such as automotive worker strikes and the threat of a government shutdown, which loom and could potentially impact the US economy.

Producer Price Index (PPI) MoM
The latest US PPI inflation data for September is somewhat surprising. The headline rate rose 0.5% month-over-month, beating the 0.3% consensus, while the core rate rose 0.3% month-over-month, beating the 0.2% expected. Although it doesn’t always correlate directly with the CPI, these figures make it more likely that today’s CPI data will show a monthly increase of 0.4% and 0.3% for the core, higher than the 0.1% and 0.2% monthly readings, which would be consistent with a return to the 2% year-over-year inflation target.
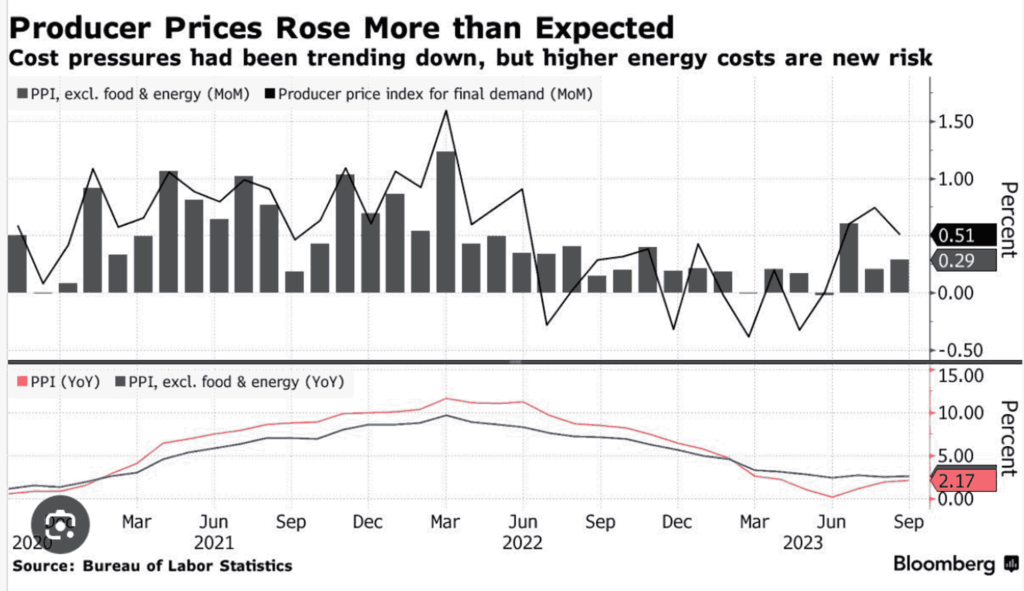
Interestingly, the market’s reaction to the higher-than-expected PPI numbers has been fairly muted. The majority of investors are siding with the view that small deviations from the disinflation path can be sustained, mainly because the market’s rise in interest rates is making the Fed reluctant to pursue further rate hikes. This narrative is supported by various Federal Reserve speakers, such as Christopher Waller, who suggested that the FOMC could take a cautious approach and monitor developments before making further rate adjustments.
This somewhat dovish stance from the Fed somewhat overshadows yesterday’s release of the FOMC minutes, which indicated that members viewed inflation as “very elevated”. However, the minutes also highlighted that “all participants agreed that policy should remain firm for some time,” underscoring a highly uncertain economic outlook. Economists in the U.S. note that the Fed had become more cautious even before the spike in Treasury yields, reinforcing the notion that interest rates may have peaked.
Unemployment Claims
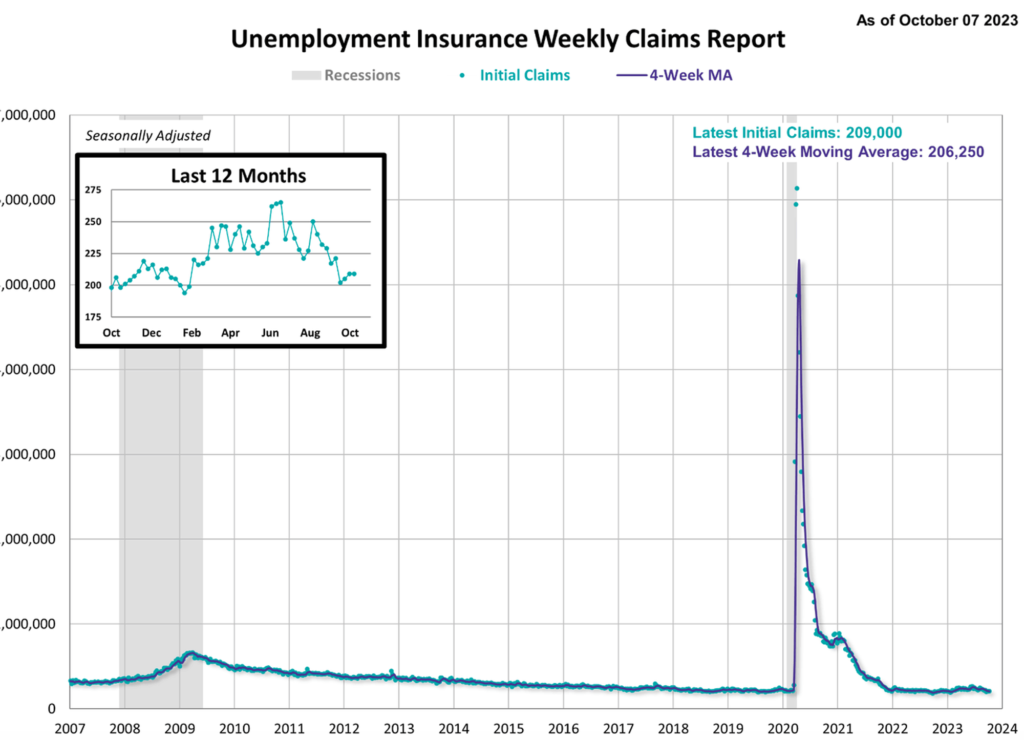
The number of Americans filing for unemployment benefits held steady at historically low levels last week. This is another indicator that the U.S. labor market continues to show strength despite the rise in interest rates. A report from the Labor Department on Thursday showed that initial claims for unemployment benefits remained at 209,000 for the week ending October 7th.

In addition, the four-week moving average of claims, which smooths out week-to-week fluctuations, fell by 3,000 to 206,250.
Continuing claims for unemployment insurance rose to 1.7 million for the week ending September 30, an increase of 30,000 from the previous week.
Inflation Rate
U.S. inflation outpaced expectations in September, increasing the likelihood that the Federal Reserve will raise interest rates in line with data on the strength of the labor market.
According to the Bureau of Labor Statistics, the consumer price index rose 3.7% from a year earlier, the same rate as the previous month but contrary to economists’ expectations for a slight decline.
On a monthly basis, inflation slowed to 0.4% from 0.6%, partly due to easing pressure from energy prices. However, “core” inflation, which excludes volatile energy and food prices, remained steady at 0.3% m/m. Year-on-year, core inflation also declined slightly from 4.3% to 4.1%.
Treasury yields rose following the release of the CPI data, although they remain below the highest levels in the past 16 years. The yield on the two-year note, known for its sensitivity to interest rate expectations, rose 0.07 percentage point to 5.08% in midday trading in New York. It’s worth noting that when yields rise, bond prices fall.
BTC & ETH Price Analysis
BTC has been below its 200-week MA resistance line for eight consecutive weeks, and finally touched this resistance line last week. Recent macroeconomic data points to a more bearish scenario for the broader crypto market in the near future.

Current support for BTC is at the 200-week EMA line at a price of 25,700. Meanwhile, resistance levels are at $27,000 and $27,400.
On the other hand, ETH continues to fall and is expected to underperform BTC in the near future. Recently, ETH broke through the 200-week support line.

On-Chain Analysis
- 📊 Exchange: As the exchange reserve continues to rise, it indicates higher selling pressure. Net deposits on exchanges are low compared to the 7-day average. Lower deposits can be interpreted as lower selling pressure.
- 💻 Miners: Miners’ are selling holdings in a moderate range compared to its one-year average. Miner’s revenue is in a moderate range, compared to its one-year average.
- 🔗 On-Chain: More investors are selling at a loss. In the middle of a bear market, it can indicate a market bottom. Long term holders’ movement in the last 7 days were lower than the average. They have a motive to hold their coins. Investors are in a fear phase where they are currently with unrealized profits that are slightly more than losses.
- 🏦 Derivatives: Long position traders are dominant and are willing to pay to short traders. Selling sentiment is dominant in the derivatives market. More sell orders are filled by takers. As open interest increases, it indicates more liquidity, volatility, and attention are coming into the derivative market. The increasing trend in open interest could support the current ongoing price trend.
- 🔀 Technicals: The relative strength index (RSI) indicates a neutral condition. Stochastic indicates a neutral condition where the current price is in a moderate location between the highest-lowest range of the last 2 weeks.
News About Altcoins
- Frax Finance has launched a collateral vault called sFRAX. sFRAX is a way for users to earn income backed by US Treasury bonds. Frax Finance has also launched a bond product that will mature into the FRAX stablecoin. According to Sam Kazemian, founder of Frax Finance, users will be able to deposit sFRAX starting Monday (10/16) to earn a 10% yield, which will then be adjusted down to approximately 5.4% based on the current Federal Reserve’s Interest on Reserves Balance (IORB) rate.
News from the Crypto World in the Past Week
- G20 finance ministers and central bank governors have approved a roadmap for the regulation of crypto assets. The roadmap is designed to ensure effective, flexible and coordinated implementation of a comprehensive policy framework for crypto assets. The roadmap is based on a consolidated document that combines recommendations from the International Monetary Fund (IMF) and the Financial Stability Board (FSB). The FSB itself suggests regulatory oversight of crypto assets rather than banning them. This approach is taken to prevent the potential for harm to macroeconomic and financial stability.
- Ferrari has initiated accepting payments via cryptocurrency for its luxurious sports cars in the United States and intends to expand this payment option to Europe, as conveyed by Enrico Galliera, the company’s Chief Marketing and Commercial Officer, to Reuters. This decision was driven by requests from clients and dealers, with plans to further explore crypto usage in other regions that legally accept digital currency. Ferrari has partnered with BitPay, a cryptocurrency payment processor, to implement this scheme while safeguarding dealers from crypto price volatility.
Cryptocurrencies Market Price Over the Past Week

Cryptocurrencies With the Best Performance
- Rocket Pool (RPL) +15,26%
- Basic Attention Token +5,00%
- Frax Share (FXS) +2,60%
- Flow +2,54%
Cryptocurrencies With the Worst Performance
- Stacks (STX) -1,40%
- Sui (SUI) -1,20%
- Curve Dao 0,91%
- Bitcoin Cash -0,76%
References
- Deepshikha Sikarwar, G20 finance ministers and central bank governors embrace roadmap for Crypto asset regulation, economictimes, accessed on 15 October 2023.
- Jack Kubinec, FRAX taps Treasury yields with new staking vault, blockworks, accessed on 15 October 2023.
- Giulio Piovaccari, Ferrari to accept crypto as payment for its cars in the US, reuters, accessed on 15 October 2023.
Share
Related Article


See Assets in This Article
0.5%
0.0%
0.0%
0.0%
0.0%
BTC Price (24 Hours)
Market Capitalization
-
Global Volume (24 Hours)
-
Circulating Supply
-